For several months the PHLX – Semiconductor index (SOX) has been the leading sector of the U.S. stock market. There may have been a major sell signal on 05/04/26.
The daily SOX chart courtesy of Trading View illustrates the action.
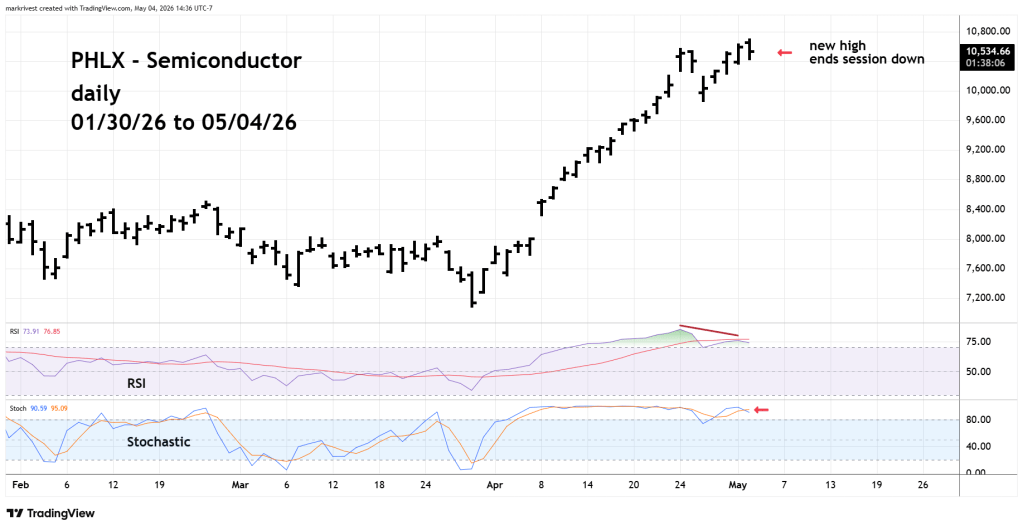
On 05/04/26 – SOX made a new all-time high and ended the session below its 05/04/26 opening session price. This is usually a bearish reversal signal.
Daily RSI had a bearish divergence in the overbought zone and Stochastic had a bearish line cross in the overbought zone.
This is additional evidence that the U.S. stock market could be forming a significant peak.
