The Dow Jones Industrial Average (DJT) began the week of 04/20/26 to 04/24/26 above the upper weekly Bollinger band. This is typically a sign of a market index or stock nearing upside exhaustion. At the open of the 04/22/26 session DJT was still above the weekly Bollinger band. What happened soon after the opening of the 04/22/26 session was dramatic.
The weekly DJT courtesy of Trading View shows the long-term action.
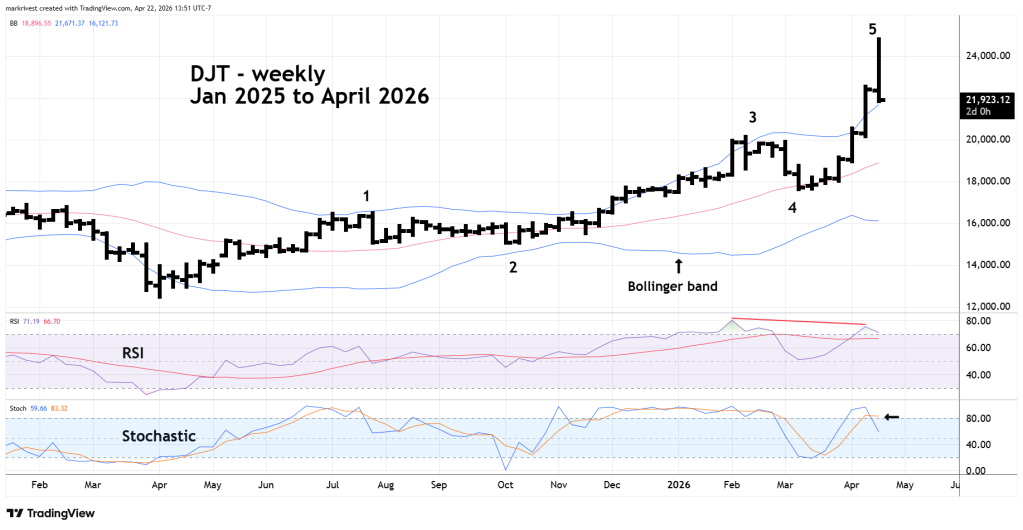
DJT ended the 04/22/26 session 8.4% below the prior day session close. From the intraday high the decline was 12%!
This incredible drop triggered weekly Stochastic lines bear cross in the overbought zone.
Weekly RSI has a bearish divergence vs. the February 2026 peak.
There’s a clear five wave Elliott Impulse pattern since the April 2025 bottom.
There’s a high probability that the DJT has made a blow off top, if so, it could decline 40% from the high made on 04/22/26.
The 04/22/26 action is additional evidence that the broader U.S. stock market could be forming an important peak.
