On 01/31/25 both the Dow Jones Industrial Average (DJI) and the S&P 500 (SPX) made runs to make new all -time highs. They failed miserably.
The DJI – two – hour chart courtesy of Trading View shows its action since its all-time high in early December 2024.

In the first minute of the DJI trading session on 01/3125 it reached 45,040.94 a mere 32.68 points from the all-time high of 45,073.62 on 12/04/24.
Recent blogs on this website have illustrated significant one – hour DJI – RSI bearish divergences. Even on the two – hour time scale there’s a double bearish RSI divergence.
In recent trading days DJI has resumed upside leadership among the three main U.S. stock indices. On 01/31/25 it peaked about an hour and a half before the SPX and Nasdaq Composite. The DJI could continue to be the leader – now to the downside.
The one – hour SPX chart illustrates its movements since it’s all – time high on 01/24/25.
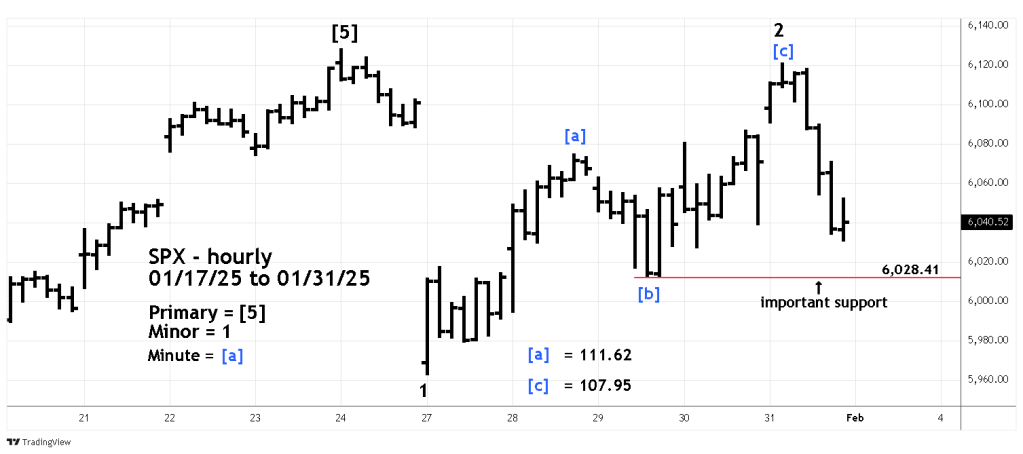
On 01/31/25 the SPX peaked at 6,120.91 only 7.27 points from it’s all – time high of 6,128.18 made on 01/24/25.
The micro crash of 01/24/25 to 01/27/25 appears to be an Elliott wave impulse pattern. If so this drop could be just the first phase of a larger developing bear trend.
The most common Fibonacci price relationship is equality or tending towards equality. The subsequent rally from 01/27/25 to 01/31/25 is very close to equality with the 01/24/25 to 01/27/25 decline.
The equality price relationship also appears in the 01/2725 to 01/31/25 rally.
With Elliott wave Single Zigzag corrections, the most common price relationship between waves “a” and “c” is equality. The presumed Minute wave [a] was 111.62 points. The presumed Minute wave [c] was 107.95 close to equality with Minute wave [a].
Two Fibonacci coordinates close to each other represent potentially powerful resistance.
Volume activity on 01/31/25 supports the bearish case. The one – minute S&P 500 – E- Mini Futures (ESH2025) chart for the March 2025 contract shows its intraday action.
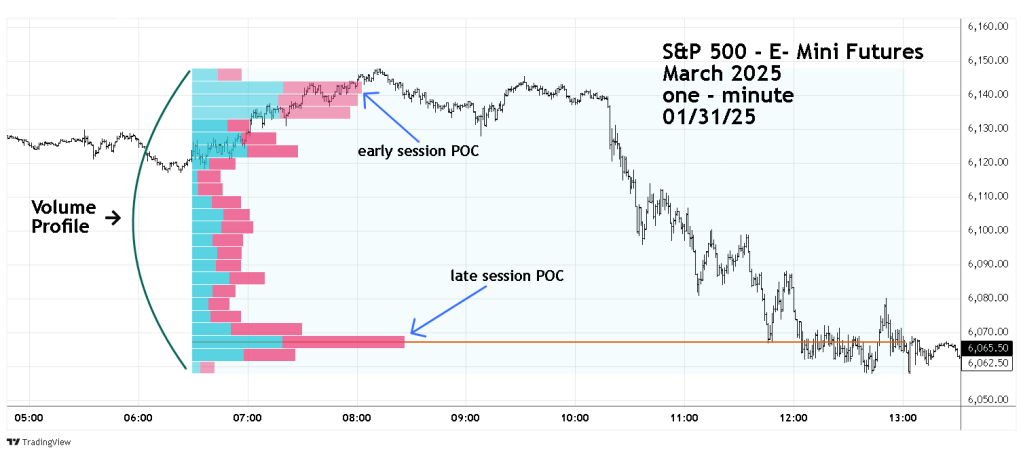
The Volume Profile method places volume on a vertical axis, matching volume with price action. The widest part of the profile is called Point of Control (POC) and represents the strongest potential support/resistance.
When POC moves in the direction of price it confirms the trend. In the early part of the 01/31/25 session POC remained in the upper price range. Later in the session a secondary POC formed in the lower price range. By the close of the session the lower POC was the primary confirming the downward price trend.
The price action at the open of the main futures trading session – 9:30 AM – ET on 02/03/25 could be very important. If ESH2025 opens above the 01/31/25 POC it implies an uptrend on 02/03/25. If ESH2025 is below the 01/31/25 POC it implies a down trend for the day.
Three factors from the Time dimension could be in play.
First is a potential lunar time cycle. Sometimes markets will change trend on Full/New moons plus or minus two trading days. There was a New Moon on 01/29/25 two trading days before the U.S. stock market peaks on 01/31/25.
Second, markets can change trends as they enter new calendar periods either yearly, quarterly or monthly. In this case stock fund managers could be inclined to sell in February to preserve the gains made in January.
Third is economic fundamentals. On 02/01/25 the U.S. Government is imposing tariffs on imported goods from China, Mexico, and Canada. These tariffs may or may not have an adverse effect on the U.S. or global economy. However, the tariffs could trigger a bearish perception from stock fund managers. Tariffs could be a major reason for selling or short selling of stocks in February 2025.
Coincidentally 01/29/25 was the Chinese Lunar New Year. 2025 is the Year of the Snake. For stocks February 2025 could be the Month of the Bear.
