The 07/21/214 blog “Bearish Message from Gold and Silver” noted considerable evidence that both precious metals could soon begin a multi-week decline. Since then, Gold (XAUUSD) has exceeded its mid – July 2024 peak, while Silver (XAGUSD) continues to lag on the upside. A severe downward shift for both metals could be imminent.
The weekly Gold chart courtesy of Trading View updates the momentum picture.
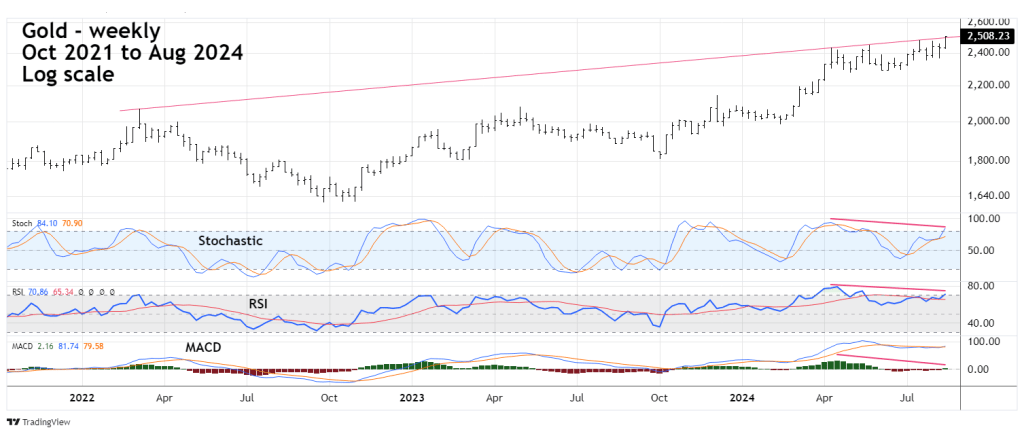
Bearish momentum divergences remain for Stochastic, RSI, and MACD. Also note that Gold has marginally exceeded the long-term rising trendline from the top made in March 2022. On the short-term this throwover is additional bearish evidence, which will be explained in the final chart of this blog.
The next weekly Gold chart courtesy of Barchart.com illustrates the Gold futures Commitment of Traders (COT) report.
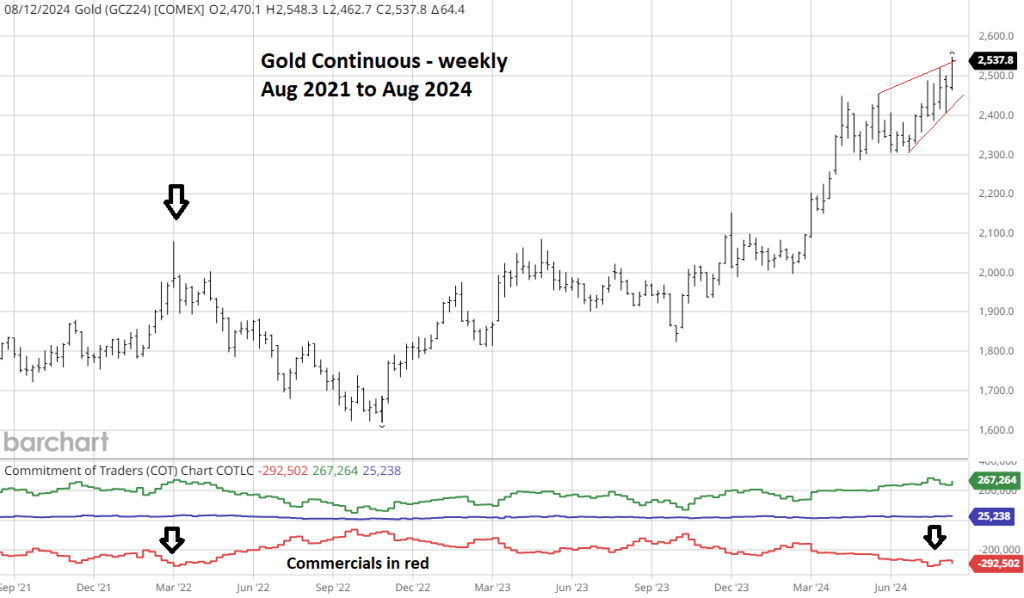
The COT tracks the futures positions held in various markets. The three main groups recorded are Large Speculators, Small Speculators, and Commercials. Commercials are the group to follow because they hold the most futures contracts and presumably have the most knowledge of their particular market.
Prior to mid – 2024 the largest Commercial net short position was in March of 2022 which corresponded with the high of Gold that year. This high net short position was matched in July of 2024. Commercial extreme positions are not precise for timing price tops or bottoms Price tops or bottoms could come within weeks of Commercial extreme positions. The most recent Commercial net short position is very close to the July 2024 reading and implies a significant Gold peak could be forming.
Also note Golds bearish wedge that’s formed since May 2024.
The monthly Gold and Silver chart illustrates their long-term relationship.

On a long-term basis Silver has been underperforming Gold on the upside for several years.
The 07/21/24 blog illustrated a modest short-term bearish divergence between Silver and Gold. Within one month the divergence is now large. If a significant bullish move was developing both metals should be making rally highs simultaneously. They are doing the opposite and pulling apart. There’s a high probability both could soon be trending down, with Silver leading the way.
The daily Gold chart illustrates the prime Elliott wave count from the November 2023 bottom.
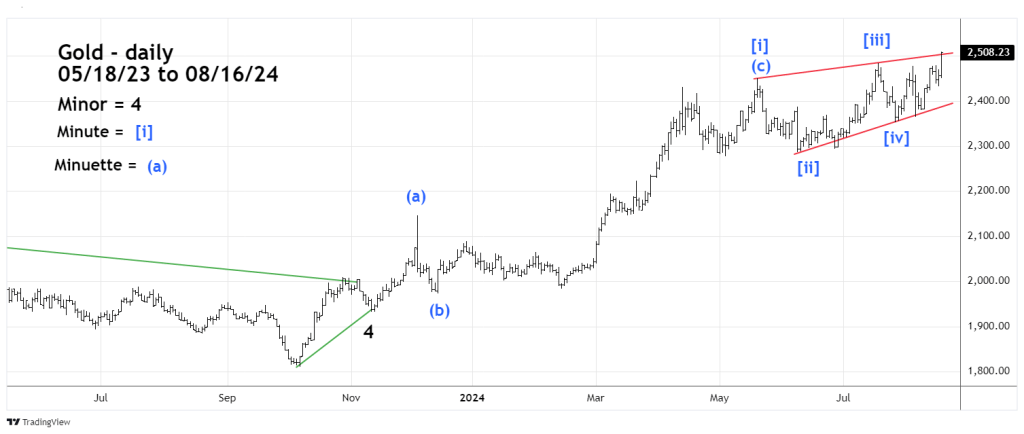
It appears that Gold is forming an Elliott wave – Ending Diagonal Triangle (EDT) from the 11/13/23 bottom. EDT’s are a pattern that terminates a larger movement, they occur in the fifth wave position of motive patterns and in wave “C” of corrective patterns. They form a wedge shape and each of the five main sub waves themselves subdivide into three waves.
Frequently there’s a brief throw over of the trendline connecting the termination points of the first and third waves of the EDT. This is what happened near the end of Gold’s trading session on 08/16/24. This throw over could mark the completion of the EDT and the start of a significant decline.
There’s also one other factor that could have bearish implications and it comes from the time dimension.
Sometimes markets can have trend changes within one or two trading days of a Full/New Moon. There’s a Full Moon on 08/19/24.
The significance of a market top or bottom is directly related to the amount of evidence that a turn could take place.
For Gold in mid-August 2024 there’s bearish evidence from all four market dimensions.
Momentum: bearish divergences on Stochastic, RSI, MACD, and Silver.
Sentiment: largest Commercial net short position in three years.
Price: Eliott wave – EDT and proximity to long-term rising trendline.
Time: Full Moon on August 19, 2024.
Gold and Silver could be on the cusp of a multi-month decline.
