One market currently has two factors that strongly imply at least a one-month bull run. That market is Soybeans.
Most of the information about the current Soybean bullish set up comes from a recent interview with the legendary trader, author, and market analyst Larry Williams.
The weekly continuous Soybean chart courtesy of Barchart.com illustrates the long-term picture.
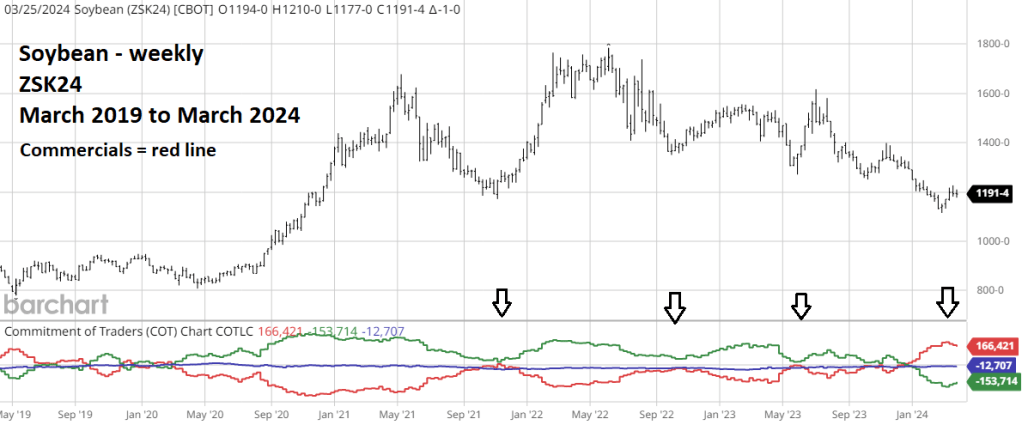
The Commitment of Traders (COT) tracks weekly the net futures positions of three trading groups; Small speculators, Large speculators, and Commercials. The group to follow are Commercials. they have the most money and knowledge of the futures they trade.
Large Commercial net long positions tend to correspond to market bottoms. Large Commercial net short positions tend to correspond with tops. The large Commercial positions are not a precise timing tool, they identify a set up for a potential market turn.
Please note the prior three large Commercial long positions came close to Soybean bottoms. The most recent Commercial long position is the largest recorded in the history of Soybean COT reports.
Larry Williams also explained Soybean seasonal factors. The Soybean futures seasonality chart courtesy of EquityClock.com shows what could happen in April.
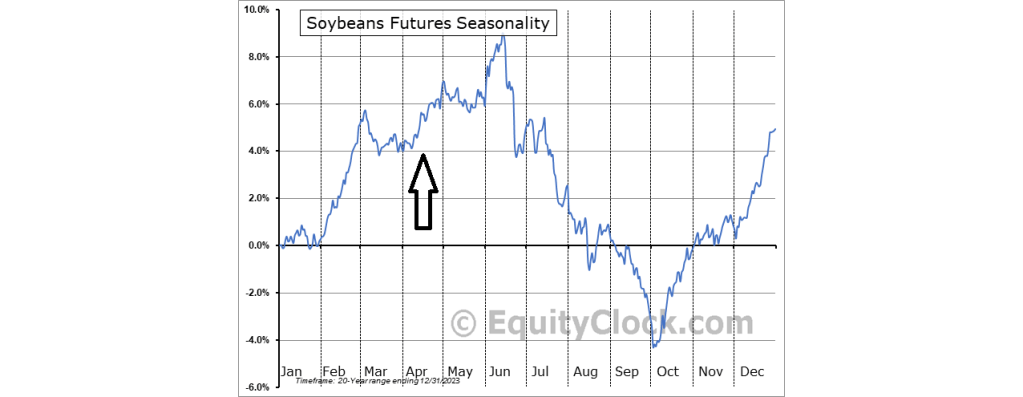
After a late March decline Soybeans seasonally trend up throughout most of April.
Larry Williams called the bullish Soybean set up a “Jessie Livermore trade” – going long above a high point. Jessie Livermore was one of the greatest traders in history. His main technique was to buy/sell strong trending stocks and commodities at new highs/lows.
The 18 -day and 50 – day Moving Averages are tools to use in timing upside/downside trade entries.
The daily May – Soybean chart shows the 50 – day moving average (MA).

Long orders could be made above the 50-day MA. If the price subsequently moves below the 50-day MA exit the long position. In the current situation wait for a move above 50-day MA and a move above the most recent price high at 1,226’6.
Because Soybeans tend to trend very well the upside target could be reached sometime in April 2024.
One area Larry Williams did not discuss was the Soybean – Elliott wave count.
The daily May- Soybean chart courtesy of Trading View illustrates the short-term Elliott wave count.

Since late February, Soybeans have completed a five – wave Elliott Impulse pattern and may have just completed a three – wave correction. This implies Soybeans could soon start another rally that exceeds the high point at 1,226’6.
From an Elliott analytical perspective its tempting to enter a long trade on a pull back. Because Soybeans trend very well, and the enormous Commercial long position the superior long entry point is above the recent high at 1,226’6.
Agriculture commodities may require more fundamental analysis than other markets. The current Soybean market is an exception. The huge Commercial net long position combined with bullish seasonal patterns are dominant factors.
For those interested in speculating on a Soybean bullish move there’s a non – leverage Exchange Traded Fund – Teucrium Soybean- symbol (SOYB).
