The S&P 500 (SPX) could be in the last part of a rally that began in October 2022.
The 02/29/24 blog illustrated that an Elliott wave – Horizontal Triangle could be developing. Also noted – a low probability the Horizontal Triangle could already be complete.
The 15 – minute SPX chart courtesy of Trading View updates the action.

Most of the time Horizontal Triangles have an elongated look. The actions of Minuette waves ( a ) through ( b ) have the correct look. The movement of wave’s ( c ) through ( e ) were shorter than normal.
After completion of a Horizontal Triangle there’s usually a thrust in the main trend direction, which in this case is up. The SPX move up after Minuette wave ( e ) is what is expected of a post triangle thrust.
The SPX reached the bulls eye Fibonacci target at 5,131 and continued higher reaching 5.140.33. There’s evidence suggesting the SPX could continue higher. Note that the 15 – minute RSI peak corresponded with the SPX high of the day. Most of the time, stock indices – peak RSI readings in the overbought zone imply more upside action. After RSI peaks in the overbought zone, there’s usually at least one bearish divergence before a significant price top is made.
The daily SPX chart courtesy of BigCharts.com illustrates additional evidence.
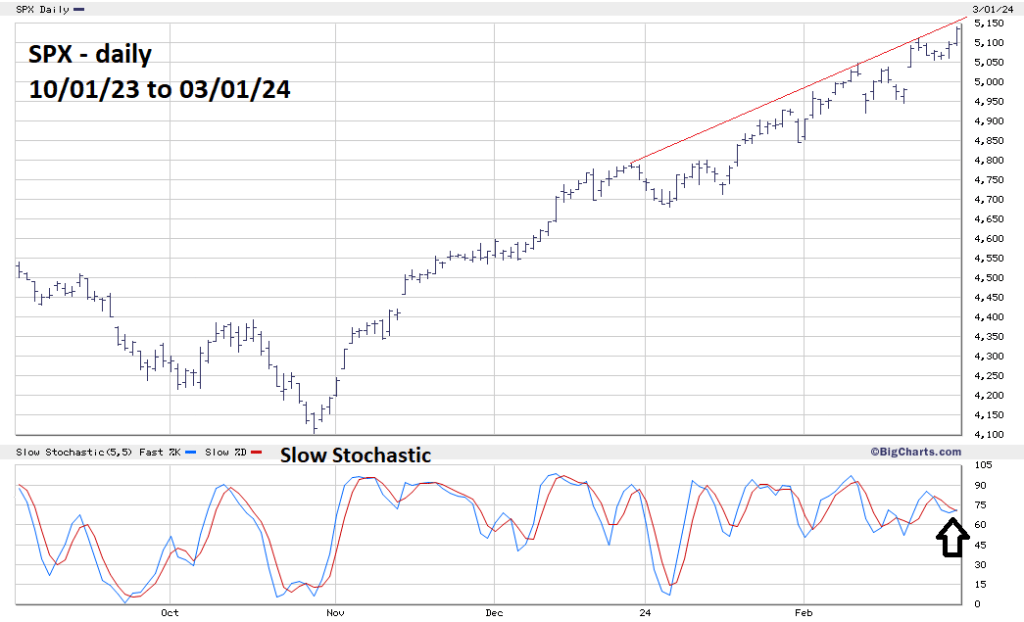
The BigCharts.com – Slow Stochastic indicator is very effective in identifying price movements. On 03/01/24 the fast line – in blue crossed above the slow line – in red. This is a bullish crossover implying higher prices.
Also note the rising trendline from late 2023. The SPX could touch this line somewhere in the low 3,150 area.
There’s always leeway around Fibonacci support/resistance points. The coordinates for the SPX 5,131 resistance are derived from the top made in January 2022, and the October 2022 bottom. In this case leeway could go to 5,160.
The SPX could make an important top on 03/04/24 or 03/05/24.

Market never fall. Next level – 6 666 )))
LikeLike
Thanks for the comment.
LikeLike