On 03/01/24 Apple Inc. (AAPL) broke below important support and could soon drop to its October 2023 bottom.
The daily AAPL chart courtesy of Trading View shows what happened.
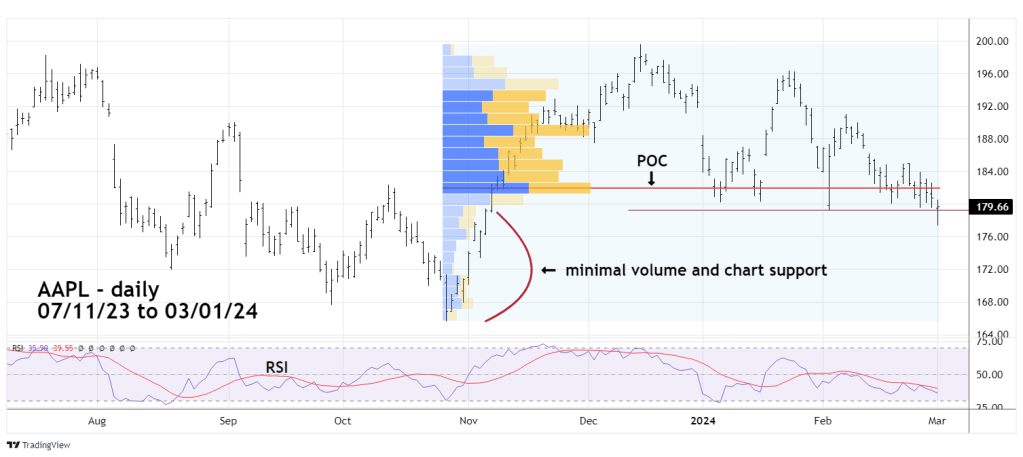
The 02/15/24 blog “Apple Inc. Downside Rollover” noted AAPL had a double bottom with the key point at 179.25. This level was pierced on 03/01/24 along with another support zone .
The Volume Profile method places volume on a vertical axis. This helps to reveal dominant price levels based on volume. The wider the Volume Profile the greater potential support/resistance. The widest area is called Point of Control (POC). Price tends to move towards or away from POC. A break above/below POC can be very significant.
Note that below 179.25 there’s minimal chart and volume support, this is sometimes referred to as “air”. There’s a good chance AAPL could quickly move through this “air” and reach the next significant price support. The October 2023 bottom.
Also note that daily RSI has yet to reach the oversold zone which begins at the RSI 30.00 level.
The next daily AAPL chart gives a longer-term perspective.
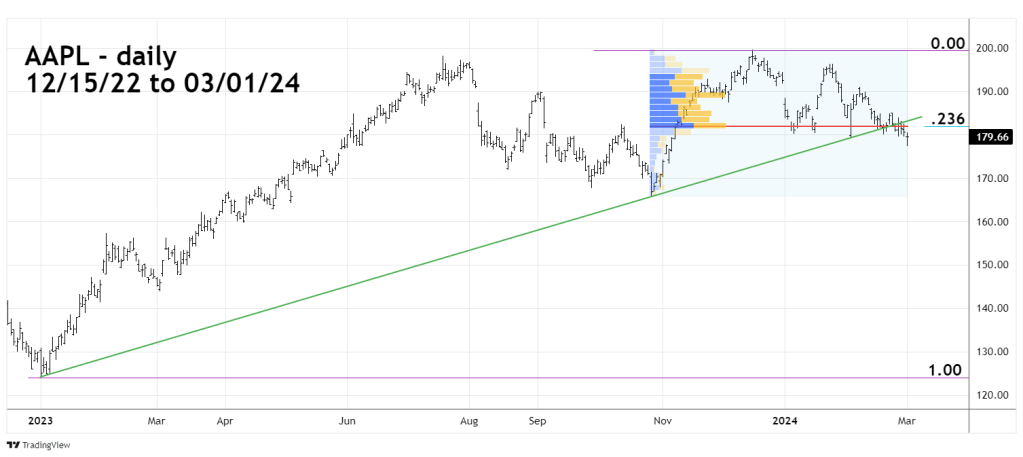
AAPL has also broken decisively below the rising trendline from the early 2023 bottom.
Another amazing aspect is the break below Fibonacci .236 retracement of the January 2023 to December rally. Note that the retracement is almost at the same level as POC!
A break below price support, POC, trendline and Fibonacci retracement strongly implies a significant decline could be underway.
The 02/28/24 blog “Alphabet Inc. Major Downside Break” noted this important stock had also broken several support points. Now AAPL appears to have jumped abord the bear train.
The movements of these two stocks could be the prelude to a broader U.S. stock market decline.
