Recently the Nasdaq Composite (IXIC) has been making new post October 2022 rally highs unaccompanied by the S&P 500 and the Dow Jones Industrial Average. This by itself is evidence that the U.S. stock rally from the 10/13/22 bottom is losing strength. An examination of Nasdaq momentum indicators reveals its rally is weak and a downturn could be imminent.
The daily IXIC chart courtesy of Trading View illustrates the Elliott wave count since the all-time high in November 2021.
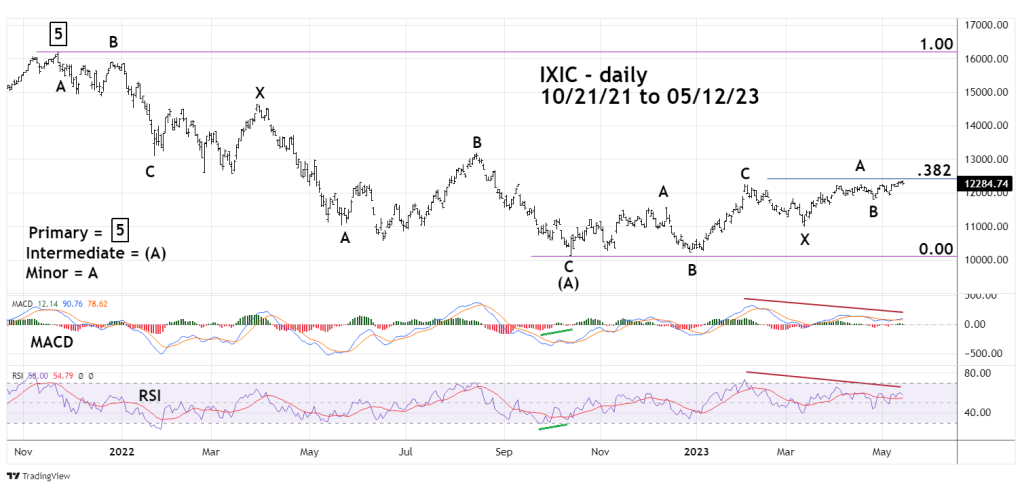
The IXIC November 2021 to October 2022 decline took the form of an Elliott wave – Double Zigzag. Note the bullish RSI and MACD divergences at the 10/13/22 bottom.
The rally subsequent to that bottom appears to also be taking the form of a Double Zigzag. The momentum peak for this rally was at the 02/02/23 top – labeled Minor wave “C”. The movement above that high point has significant RSI and MACD bearish divergences.
Also note that IXIC is close to a Fibonacci .382 retracement of the November 2022 to October 2023 decline. The exact level is 12,427.71. The IXIC 2023 high made on 05/12/23 was 12,364.65 which is within leeway of the .382 coordinate.
When you have momentum divergences with price near a Fibonacci support/resistance zone – there’s a good chance for a trend reversal.
The daily Nasdaq – 52 -week highs ($MAHQ) courtesy of Barchart.com examines internal market strength.

Momentum oscillators such as RSI and MACD are sometimes called external market indicators. Advanced/Decline lines and 52 – week highs/lows are sometimes called internal market indicators.
Post October 2022 rally maximum internal strength occurred on 02/02/23 – same as the external indicators. The subsequent price move above the early February peak shows a significant loss of strength.
The 15 – minute IXIC chart zooms in on the short-term picture.
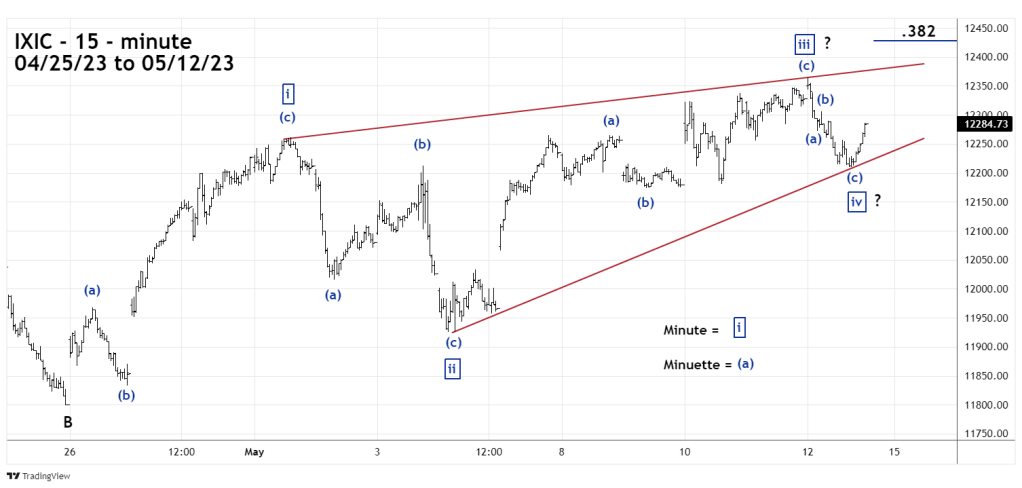
The rally after the 04/25/23 bottom appear to be a developing Elliott wave – Ending Diagonal Triangle. This formation is found at the termination points of larger patterns. They have a wedge shape and occur in the fifth wave position of motive waves, and in wave “C” of corrective waves. Frequently price will throwover the trendline connecting the peaks of waves “one” and “three”.
Note its possible the Ending Diagonal Triangle completed at the 05/12/23 top. If price moves above 12,36.65 it could mean the Ending Diagonal Triangle is in its final wave.
Elliott wave structure, Fibonacci resistance and weaking momentum indicate a downside IXIC move could be imminent. Additionally, all of this is happening at the start of a seasonally bearish period.
Its possible a major Nasdaq top was made on 05/12/23 or could be made on 05/15/23.
Watch the Nasdaq Composite!
