It’s possible the S&P 500 (SPX) made an important top on 05/01/23. This blog will explain why an SPX top could be in place and one level for shorting the SPX.
The three factors imply an important SPX top could be in place.
Time cycles.
Alternate Elliott wave count.
Rule of the majority signal.
Time cycles.
“Sell in May and go away” is not just a Wall Street cliché its real. The 2023 edition of the “Stock Traders Almanac” shows the Dow Jones Industrial Average (DJI) May 1 – October 31 from 1950 to 2021 average/gain was 0.8%. The average/gain November 1 – April 30 from 1950 to 2021 was 7.3%.
If there’s a May top, when in the month could it occur? Since 2006 the SPX has had four peaks in early May: 05/01/19.
05/01/12 – lower peak of a double top.
05/02/11.
05/08/06
Since 2006 three SPX tops occurred in the second half of May: 05/20/15.
05/22/13.
05/19/08.
The 04/29/23 blog “Cycle Top Due on May 5, 2023” illustrated an SPX – Fibonacci equality time cycle targeting 05/05/23 as the bulls eye turn date. The time cycle spans 16 – months, the leeway could be one or two weeks. The SPX post October 2022 rally high was 05/01/23, and within leeway of the Fibonacci time cycle. If the SPX were to make a new post October 2022 rally high after 05/12/23 – the time cycles effectiveness would be in doubt.
Alternate Elliott wave count.
In Elliott wave analysis there are always alternate wave counts, at least one bullish and one bearish.
The 05/06/23 blog “Expanding Flat Correction Complete – Part – Two” illustrated an Elliott wave Expanding Flat correction ending on 05/04/23. The third and final phase of an Expanding Flat subdivides into five – waves, in this case it’s an Impulse pattern. When an Expanding Flat finishes with an Impulse pattern, it could also be the first wave of a larger developing formation.
The 5-minute SPX chart courtesy of Trading View illustrates the alternate wave count.
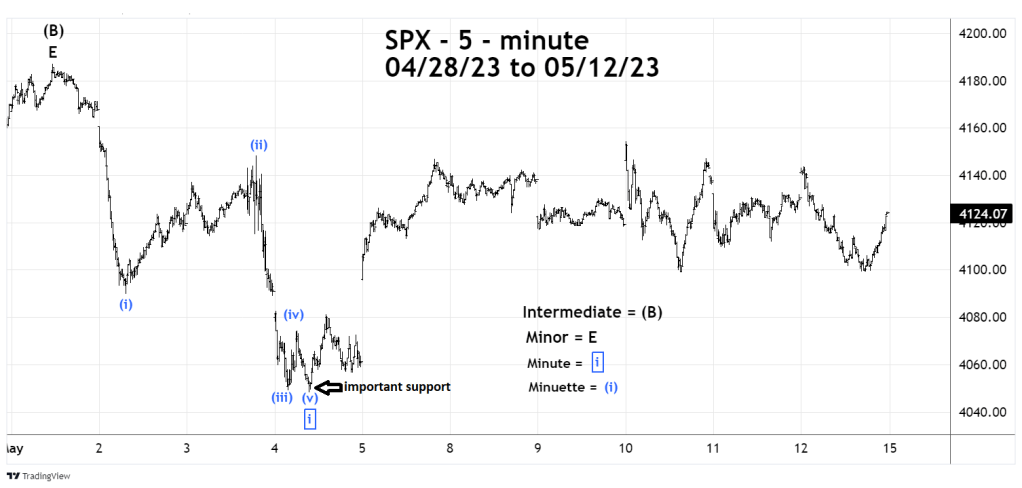
The five – wave SPX drop from 05/01/23 to 05/04/23 could be just the first wave down of a larger – possibly much larger developing bear move.
The choppy rally since the 05/04/23 bottom could be a complete or still developing Minute wave “ii”. If the SPX were to break even one tick below the 05/04/23 bottom at 4,048.28 it could be heralding a significant decline.
Rule of majority signal.
Several blogs on this website have noted what I call a “Rule of the majority signal”. This occurs when one of the three main U.S. main stock indices; S&P 500 (SPX), Dow Jones Industrial Average (DJI), and Nasdaq Composite (IXIC) make a new high/low unconfirmed by the other two indices. The signal for a potential trend change is with the two non-confirming indices.
The daily SPX, DJI, and IXIC chart illustrates what’s been happening.
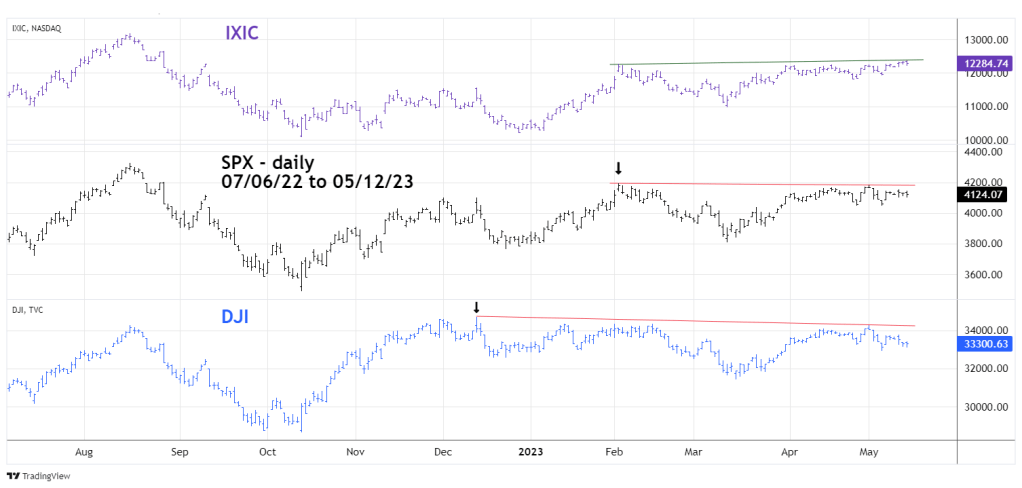
The DJI post October 2022 rally high was made on 12/13/22.
The SPX post October 2022 rally high was on 02/02/23.
The IXIC as of 05/12/23 was still making a new post October 2022 rally high.
The SPX and DJI non- confirmations could be the prelude to a significant U.S. stock market decline.
The daily SPX chart shows what could be its prime Elliott wave count.
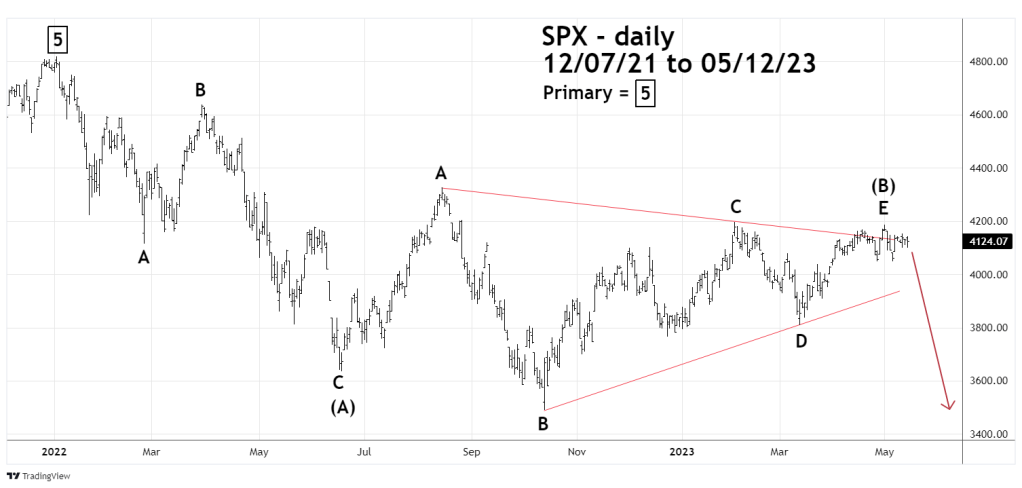
If this wave count is correct the SPX could be on the verge of a decline to at least the October 2022 bottom.
Non leveraged – Inverse SPX – Exchanged Traded Funds are good instruments for a downside SPX bet.
One potential level to short the SPX, or to buy SPX Inverse funds is a break below SPX 4,048.28.
There could be another level to make a downside bet and that depends on what the Nasdaq Composite (IXIC) does next week.
Tomorrows blog will examine the Nasdaq Composite.
