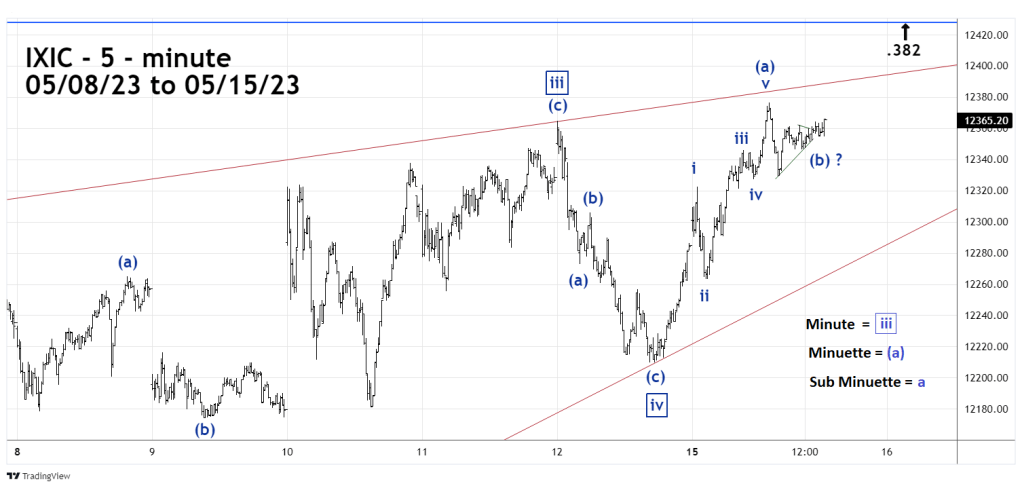
The 05/14/23 blog noted the Nasdaq Composite (IXIC) could be forming an Elliott wave – Ending Diagonal Triangle from its 04/25/23 bottom.
The 5- minute IXIC chart courtesy of Trading View updates the Elliott wave count.
Ending Diagonal Triangles sub divide into five waves. Each of the five waves further sub divide into three wave structures.
The rally off the 05/12/23 bottom labeled Minute wave “iv” sub divided into five waves which implies it was just the first of three waves of a developing Minute wave “v”. The second wave labeled Minuette wave (b) could be complete. If so the final third wave up could be completed on 05/16/23.
Watch for an IXIC move above the 05/15/23 high at 12,376.40 it implies Minuette wave ( C ) is forming.
Frequently the fifth wave of an Ending Diagonal Triangle will throw over the trendline connecting the termination points of the first and third waves.
Major Fibonacci resistance is at 12,427.97 which is a .382 retracement of the Nasdaq Composite November 2021 to October 2022 decline.
A major IXIC top could be made on May 16, 2023.
