Additional evidence that an Elliott wave – Expanding Flat correction probably completed at the S&P 500 (SPX) 05/04/23 bottom.
The chart illustrates a textbook Elliott wave – Expanding Flat.
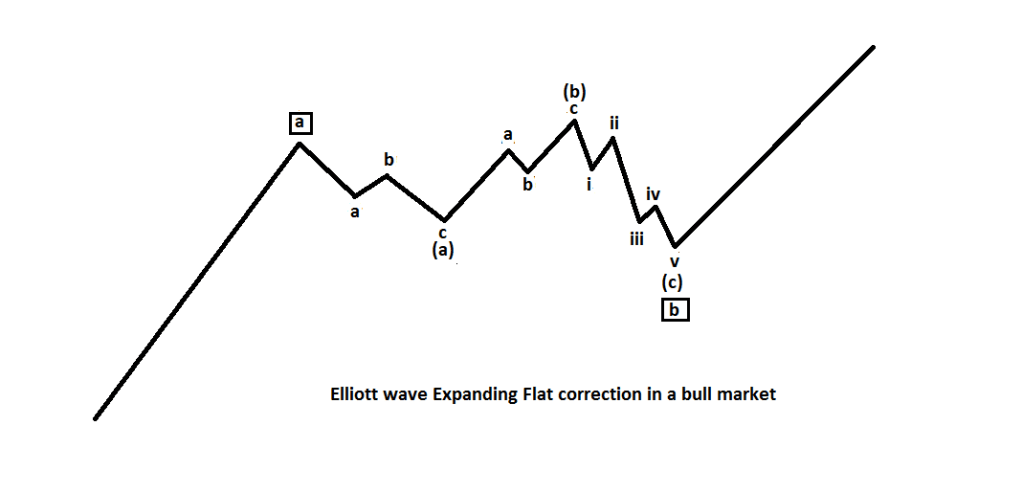
The pattern when correcting bull moves is composed of three – waves down, three waves up, and five waves down.
The SPX – 15-minute chart courtesy of Trading View shows what happened after 04/18/23.
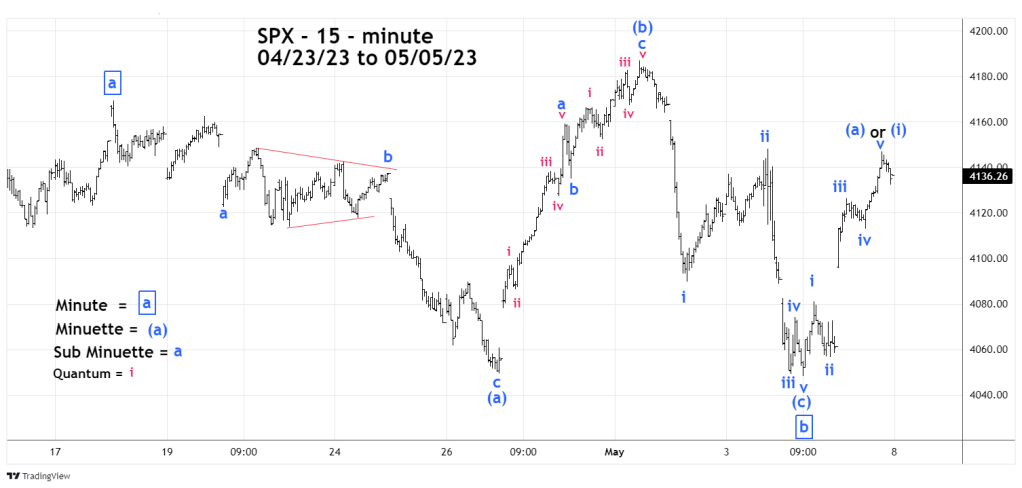
Minuette wave (a) was a Double Zigzag decline. This chart has a simplified wave count to easily illustrate three sub waves.
An examination of Minuette wave (b) reveals that both Sub Minuette waves “a” and “c” clearly subdivide into five wave patterns. The entire rally from 04/26/23 to 05/01/23 was a three – wave corrective structure.
Minuette wave (c) declined in five waves. The only difference from the textbook illustration is that Minuette wave (c) only marginally exceeded the Minuette wave (a) bottom. Typically wave “c” of an Expanding Flat will travel a bit further beyond the termination point of wave “a”.
After the 05/04/23 bottom the rally was a clear five- wave pattern. This implies more upside action that could exceed the 05/01/23 top at 4,186.92.
The next SPX – 15 – minute chart illustrates Fibonacci price and time ratios.
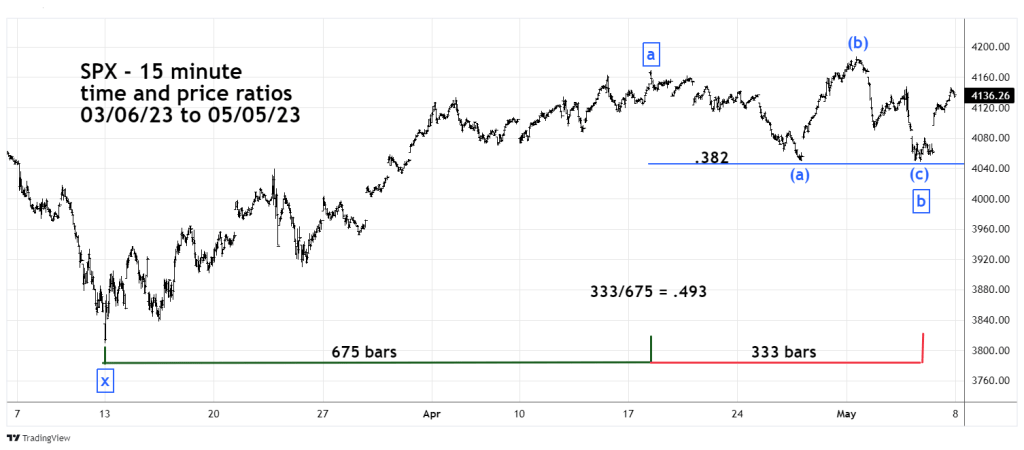
The 05/04/23 blog noted that the Expanding Flat terminated just above a Fibonacci .382 retracement of the 03/13/23 to 05/01/23 rally. There’s also a Fibonacci time ratio.
The rally from 03/13/23 to the Minute wave “a” top was 675 – 15 – minute bars. The subsequent Expanding Flat took 333 – 15 – minute bars. The ratio of 333/675 is .493 very close to the Fibonacci ratio of .50.
Elliott wave structure and Fibonacci ratios are evidence that an Elliott wave – Expanding Flat correction probably completed on 05/04/23. There’s a good chance the SPX could exceed its 05/01/23 peak sometime next week. If so it could terminate the rally that began 10/13/22.
