The 05/03/23 blog “Wild Oscillations” noted that the Fibonacci Inverse ratio of 1.145 was a characteristic of an Elliott wave – Expanding Flat or a Running Horizontal Triangle. Today 05/04/23 the S&P 500 (SPX) completed what appears to be an Expanding Flat.
The SPX – 30 – minute chart courtesy of Trading View illustrates the corrective pattern.
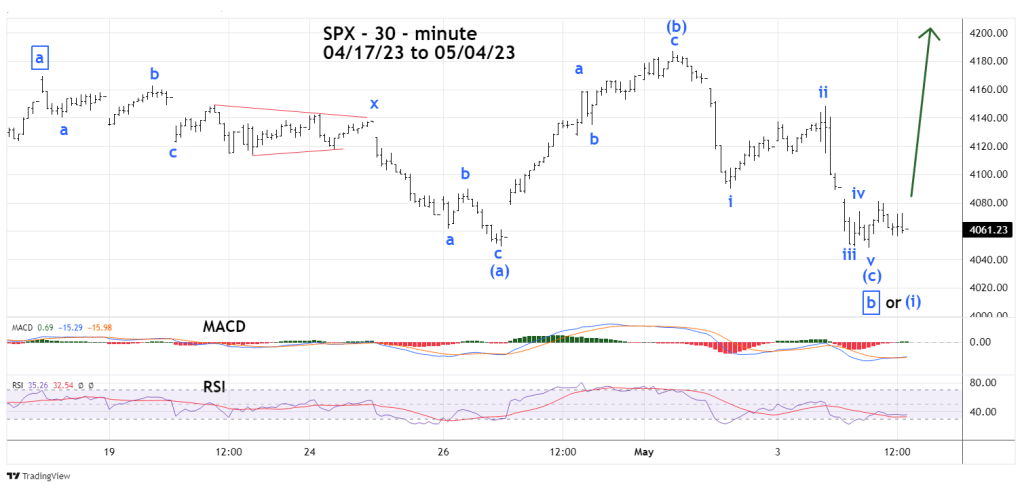
Expanding Flats when correcting a bull trend are composed of three – waves. The first wave down sub divides into three waves or in this case the down segment further sub divides into “Double Zigzags. The second wave moves up and sub divides into three waves that exceed the first wave down point of origin. The third wave down sub divides into five – waves that break below the termination point of the first wave down.
At todays bottom MACD had small bullish divergences on lines and Histogram. The RSI crossed above its moving average line and had no divergence.
If the Expanding Flat correction wave count is correct, it implies a new rally has begun that could exceed the 05/01/23 top probably sometime next week.
The SPX – 60- minute chart shows the importance of the 05/04/23 bottom.

Note that the SPX 05/04/23 bottomed out just above a Fibonacci .382 retracement of the 03/13/23 to 05/01/23 rally. If the SPX were to break below the 05/04/23 bottom, there’s no significant chart support until the Fibonacci .618 retracement area. A move below SPX 4,048.28 opens the door for a rapid drop to 3,950.00.
The 30 – minute Nasdaq Composite (IXIC) and SPX chart updates their relationship.
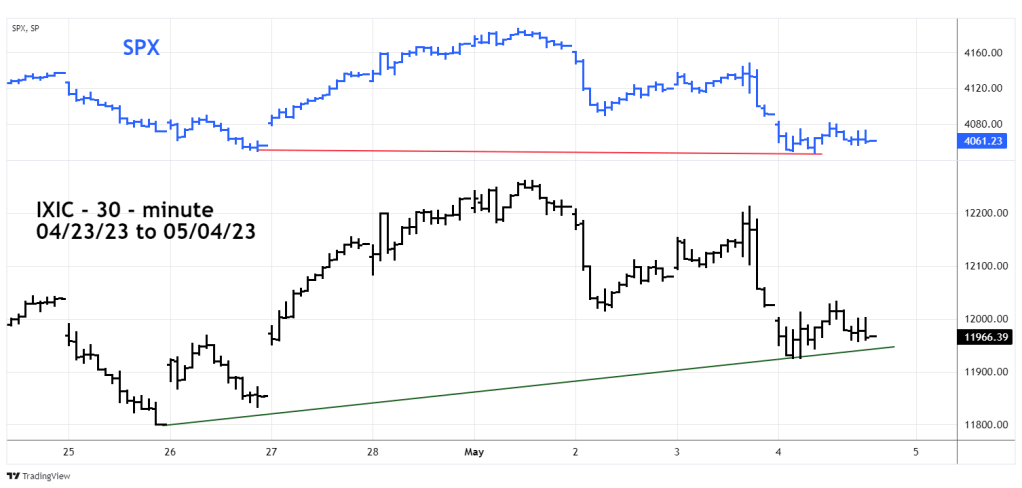
The IXIC still has a significant bullish divergence relative to the SPX. The lack of congruence between the indices implies the movement down from the 05/01/23 top is a correction within an ongoing bull trend.
If the SPX 05/04/23 bottom holds, it implies another rally that could exceed the 05/01/23 top. If so, this move up could be the termination wave of the rally that began on 10/13/22.
If the SPX fails to exceed the 05/01/23 peak and breaks below the 05/04/23 bottom; it would increase the probability that an import top may have been made on 05/01/23.
