On 04/13/23 the S&P 500 (SPX) appeared to be nearing an important top. The action on 04/14/23 has invalidated that forecast opening the door for at least another week of rising prices.
The SPX 15 – minute chart courtesy of Trading View shows what happened.
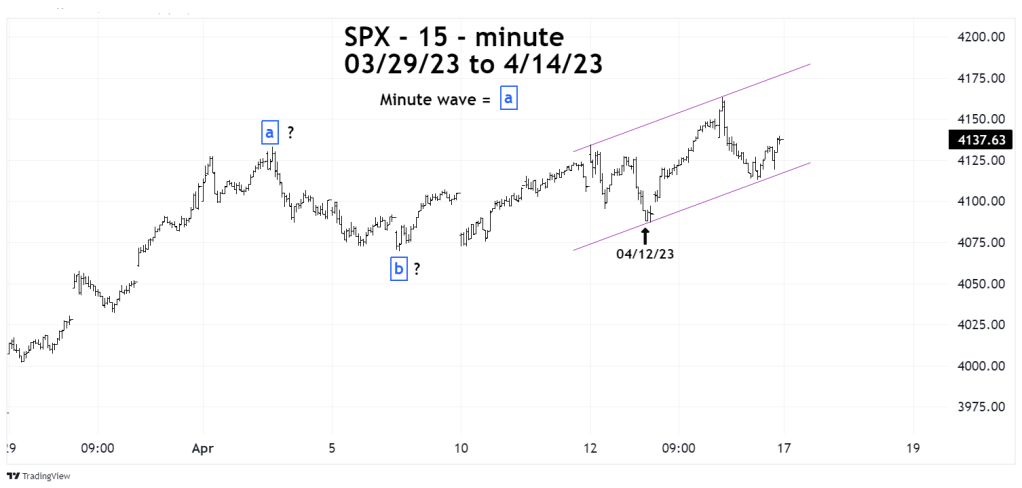
The 04/13/23 blog “Suspicious Decline – Part -Two” noted that an Elliott wave – Ending Diagonal Triangle (EDT) may have begun at the 04/06/23 bottom labeled Minute wave “b”. The presumed wave ( iii ) began at the 04/12/23 bottom.
There are three factors that make this presumed EDT highly unlikely. First, the rally from 04/12/23 to the high on 04/14/23 is longer than the presumed wave ( i ) which topped on 04/12/23. Almost all third waves in an EDT are shorter than the first wave. Second, the rally from 04/12/23 to 0/14/23 looks very much like a five-wave impulse pattern. Each sub wave of an EDT divides into three – wave patterns. Finally, EDT’s form a wedge shape. The supposed EDT rally fits into an almost perfect parallel channel.
The pattern from 04/06/23 does not look like an EDT and now appears to be an incomplete pattern needing more upside action. What that pattern could be has yet to be determined.
The daily SPX chart courtesy of BigCharts.com examines the intermediate-term view.

The Slow Stochastic indicator on BigCharts.com is very effective in catching market turns and estimating lengths of price movements. The recent bullish lines cross and their position below the overbought level of 80% hint that the SPX could rally for at least another week.
Also note that the daily RSI at the SPX 08/16/22 and 02/02/23 tops did not have bearish divergences. It’s possible the next daily SPX top could come without an RSI bearish divergence.
There are two SPX levels of importance. The first is at 4,195.44, a move above this level will invalidate the current presumed Inverse Horizontal Triangle. It will not invalidate the possibility that an Inverse Horizontal Triangle is still forming. If 4,195.44 is exceeded the next best alternate wave count is that Minor wave “C” is still under construction.
If the SPX high at 4,325.28 is exceeded it would invalidate the Inverse Horizontal Triangle wave count and open the door for additional upside action.
The weekly SPX chart examines the long -term view.

Note that the upper Slow Stochastic line has reached the overbought zone above 80% and the lower Stochastic line is close to overbought. This reinforces the theory that the SPX may only rally for one week.
There’s a Fibonacci time cycle that targeted a turn 04/11/23 to 04/12/23. It’s possible the SPX has now moved beyond the leeway zone of this time cycle. However, there’s still the broader bullish seasonal pattern that continues until late April/early May.
Next week the SPX could continue to rally, possibly reaching the area of the August 2022 top.
