Recently Saudi Arabia announced a cut in Crude Oil production. Could this be the start of a new Crude Oil bull market? Elliott wave patterns from Crude Oils top in March 2022 suggest something else could be happening.
The daily Crude Oil (CL2!) chart courtesy of Trading View illustrates the prime Elliott Wave count from the March 2022 top.
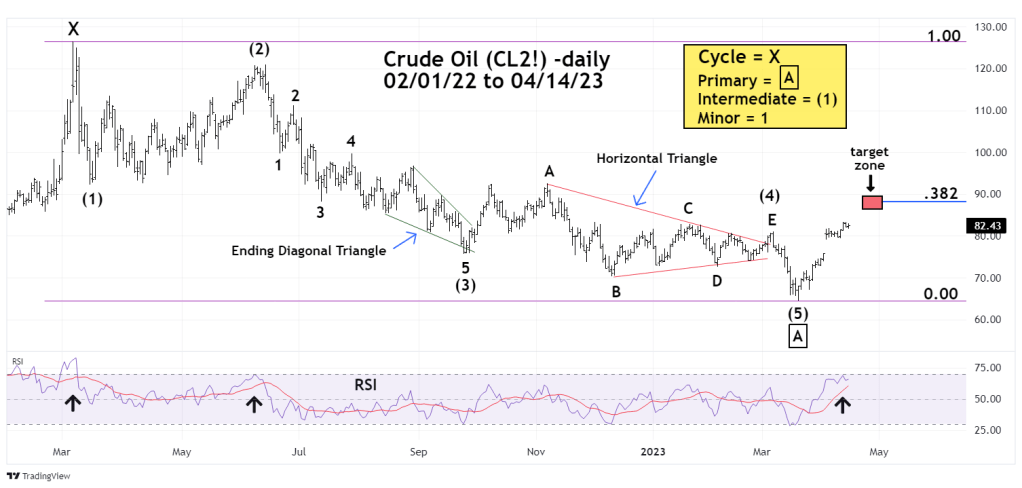
The decline from March 2022 to March 2023 took the form of an Elliott impulse pattern. If this wave count is correct the drop is the first phase of a larger developing bear market. The current rally off the 03/20/23 bottom is likely the beginning of a counter trend move that fails to exceed the March 2022 high.
Within the March 2022 to March 2023 drop, Intermediate wave (2) has a deep retracement of about 80%. Intermediate wave (4) has a shallow 38% retracement of Intermediate wave (3). These two retracements are typical of what to expect for corrections within an impulse wave.
Additionally, there’s alternation between the two corrective waves. Wave (2) is a complex Double Zigzag, Wave (4) is a Horizontal Triangle. Wave (2) lasted 63 – trading days, Wave (4) was 120 – trading days, close to a Fibonacci time ratio of .50.
Waves “one” and “five” of an impulse wave are sometimes related by the Fibonacci ratio of .50. In the March 2022 to March 2023 decline, wave (5) is .484 of wave (1).
The Fibonacci price and time relationships within the year long decline is powerful evidence that an Elliott wave impulse pattern competed at the 03/20/23 bottom. If so how long could the counter trend rally last? Time analysis provides important clues.
Elliott wave impulse waves and corrections of the same degree are usually proportionate in price and time. Primary wave “A” – boxed which bottomed on 03/20/23 was about one year in length. The Primary wave “B” rally off the 03/05/23 bottom could continue for at least three to four months. Intermediate wave (2) of Primary wave “A” lasted three months, its logical to assume the larger degree Primary wave “B” to last at least as long as the lower degree Intermediate wave (2) rally.
Seasonally Crude Oil is bullish into August with sometimes a small correction around May to June.
So far the post 03/20/23 rally has lasted close to one month. The daily RSI is near the overbought zone that begins at 70%, price is nearing a Fibonacci .382 retracement of Primary wave “A”. Its likely that any near-term top could be just Intermediate wave (A) within a still developing Primary wave “B”. If so the counter trend rally could continue sometime into the June to August time zone.
The daily Crude Oil and S&P 500 (SPX) chart illustrates their relationship.

The 03/19/23 blog “Could Crude Oil be Signaling Economic Weakness? “examined Crude Oil and the SPX. The Saudi Arabian Crude Oil production cut has at least temporarily altered the relationship. The current rally and potential rally later in 2023 are probably caused by a decrease in supply rather than an increase in demand.
The Crude Oil- Elliott wave message tells us the post 03/20/23 rally at some point could terminate below the March 2022 high. If so the next bear phase could retest and break below 03/20/23 bottom.
Assuming Crude Oil production levels stay the same, reduced demand would probably be the catalyst for a resumption of the Oil bear market.
The Global stocks could resume their bear market much quicker, perhaps in one or two weeks.
