The 04/12/23 blog noted that the decline of U.S. stocks after the open of the main trading session looked suspicious. Today 04/13/23 we saw the subsequent action after a suspicious drop.
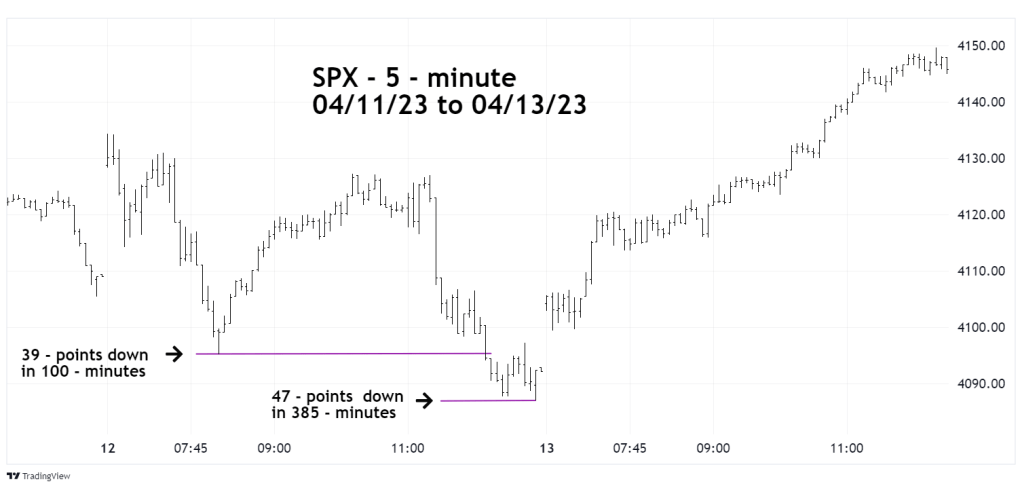
The 5 – minute S&P 500 (SPX) chart courtesy of Trading View shows the decline and what happened after the bottom.
There’s are two great lines in the book “Mind Over Markets” “Which way is the market trying to go?” and “Is it doing a good job in its attempt to go that way?”
Even if you don’t know any pattern recognition method, what happened April 12th to April 13th is a valuable lesson that can be applied to any time scale.
The deep mid – day retracement of the prior decline was a clue the bears lacked strength. Note that even through the SPX was able to make additional downside progress, the additional 8 – points lower needed a lot of time.
The market went down on 04/12/23 and did a very poor job in its attempt.
The daily SPX chart illustrates the big picture.
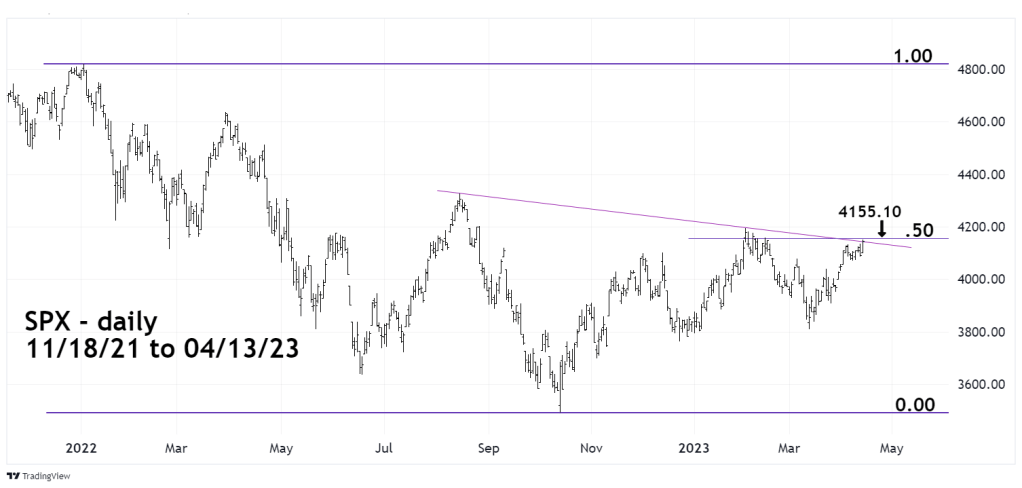
Today the SPX marginally crossed above the declining trend line connection the 08/16/22 and 02/02/23 tops. Prior blogs have illustrated these peaks as Minor waves “A” and “C” of an Elliott wave – Inverse Horizontal Triangle. The current rally that began on 03/13/23 is the presumed Minor wave “E” which can sometimes have brief throw overs of the trendline connecting waves “A” and “C”.
The 50% retracement level of the SPX January to October 2022 decline is at 4,155.10 and could be a resistance level.
The 15 – minute SPX chart shows a potential Elliott wave pattern.

The rally from Minute wave “b” – boxed looks like a developing Elliott wave – Ending Diagonal Triangle. In this pattern each of the five sub waves divide into three wave structures The presumed Minuette waves ( i ) and ( ii ) have three wave patterns. Additionally, wave “two’s” in an Ending Diagonal Triangle usually have deep retracements of wave “one’s”. The presumed Minuette wave ( ii ) has retraced 74% of Minuette wave ( i ).
The presumed Ending Diagonal Triangle could complete near 4155 on 04/14/23.
