The 02/25/23 blog noted that the S&P 500 (SPX) could marginally break below its 200 day moving average (MA) line, which did occur on 03/01/23.
The daily SPX chart courtesy of BigCharts.com updates the action.
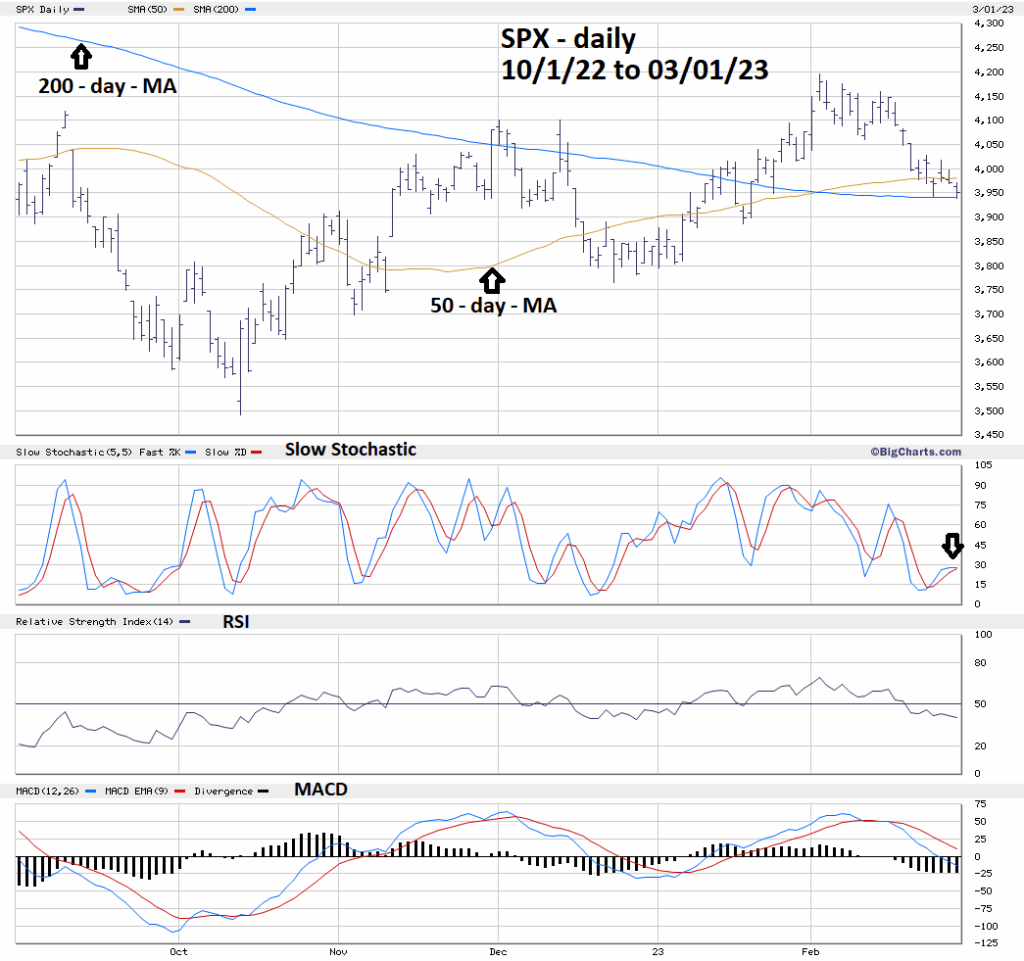
The SPX low on 03/01/23 broke marginally below its 03/24/23 bottom and its 200 – day – MA line. However, after the main session on 03/01/23 the S&P – E- Mini futures declined below its bottom made in the main trading hours 9:30 AM to 4:00 PM – ET on 03/01/23.
The SPX – Slow Stochastic after a brief bullish lines crossover is poised for a bearish lines crossover.
Daily RSI is still in the neutral zone with no bullish divergence.
Daily MACD is still trending down.
SPX action on 03/02/23 could be decisive. If the SPX does not break more than 1% below its 200 – day – MA an important bottom could be made.
A move of more than 1% below the SPX 200 – day – MA implies more downside action.
