Natural Gas looked like it may have bottomed out on 02/17/23, subsequently the bears continued to push prices lower. After bottoming on 02/22/23 Natural Gas had its largest percentage gain since the rally in early December 2022.
The daily Natural Gas chart (NG1!) courtesy of Trading View illustrates the action since November 2022.
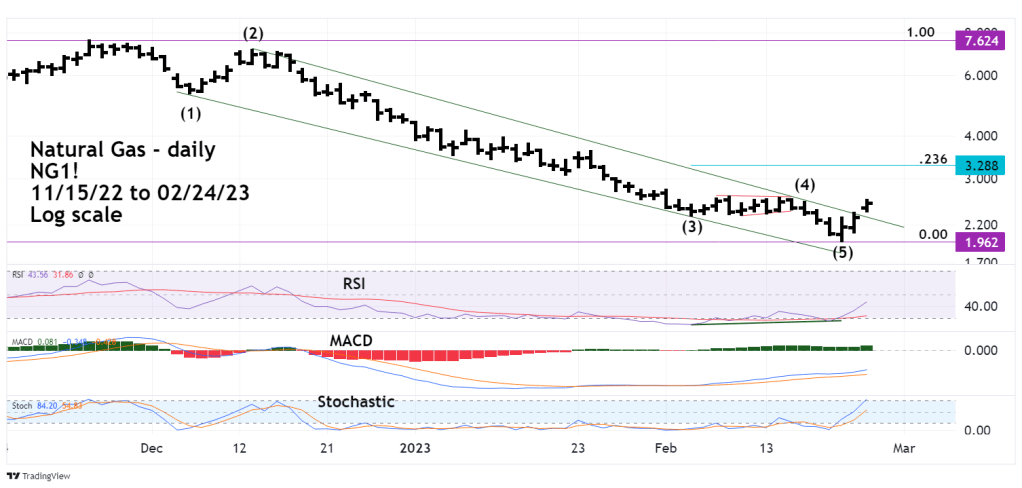
The bottom on 02/22/23 had a bullish RSI divergence. MACD is trending higher with so far no bearish divergences. The upper Stochastic line has reached the overbought zone.
Additionally, “NG1!” broke decisively above the declining trendline from the December 2022 top.
On 02/24/23 the rally reached short – term resistance in the upper area of the presumed Intermediate wave (4). If “NG1!” can break this resistance it could climb to a Fibonacci .236 retracement of the November to February drop.
