S&P 500 (SPX) bottoms in the area of two support zones.
The daily SPX chart courtesy of BigCharts.com updates the action.
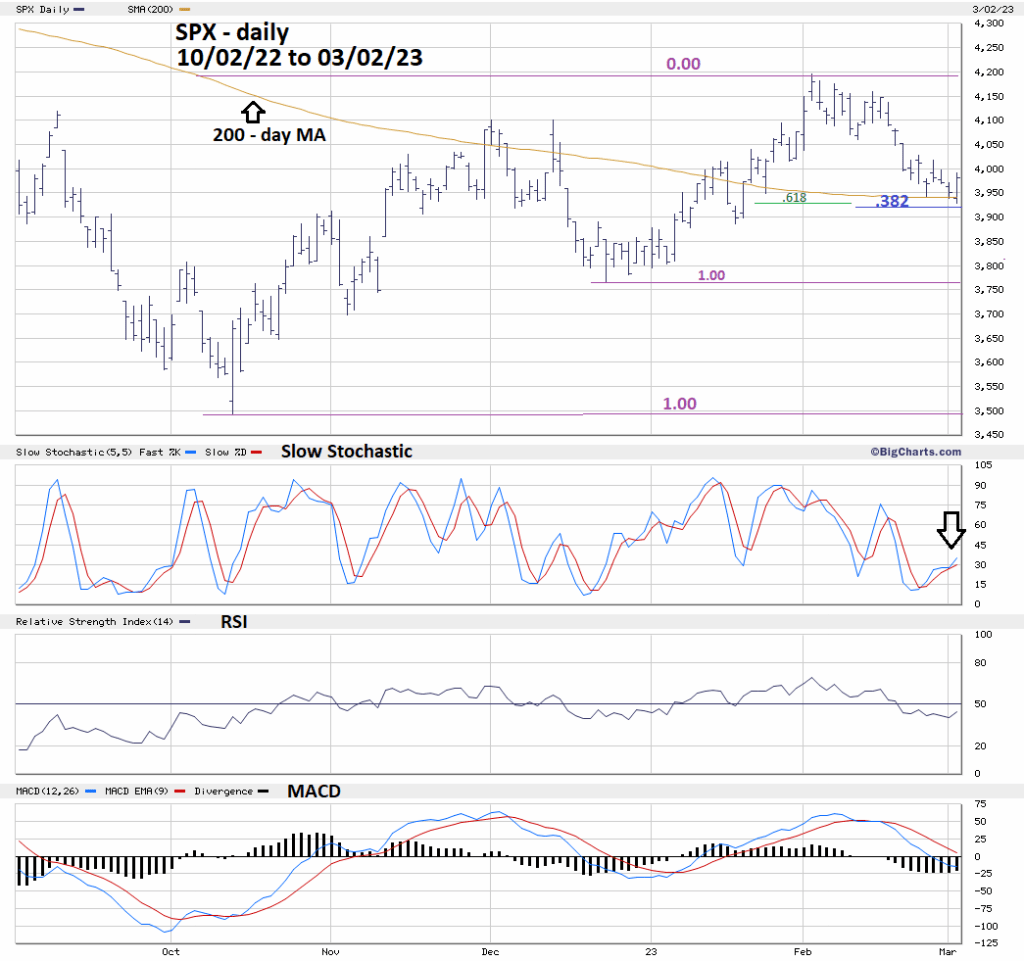
The SPX made a bottom early in the 03/02/23 session. What makes this exciting is that the bottom was in the area of the SPX – 200 – day moving average (MA) and Fibonacci support.
The 02/25/23 blog noted that the SPX could make a marginal move below the 200 – day MA. This happened on 03/01/23 and again on 03/02/23. The marginal break today reached the area of two Fibonacci coordinates.
A Fibonacci .382 retracement of the October to February rally is at 3,926.57.
A Fibonacci .618 retracement of the December to February rally is at 3,929.12.
The SPX low on 03/02/23 was at 3,928.16 in between the two Fibonacci coordinates and marginally below the SPX – 200 – day MA. Amazing!
The Investors/Traders that use the 200- day MA could view another successful defense of the 200 – day MA as a reason to go long.
Investors/Traders with knowledge of Fibonacci analysis could view the move off of two Fibonacci support levels as a reason to go long.
The 03/01/23 blog noted that the Slow Stochastic was poised for a bearish lines cross over. Today, 03/02/23 Slow Stochastic lines moved up!
There’s a high probability that the bottom made on 03/02/23 could hold. Stock seasonal patterns are bullish until late April/early May, implying a rally could continue until late April.
