On 02/24/23 the S&P 500 (SPX) bounced off of important support, however the balance of momentum indicators imply more downside action.
The daily SPX chart courtesy of BigCharts.com illustrates what’s happened.
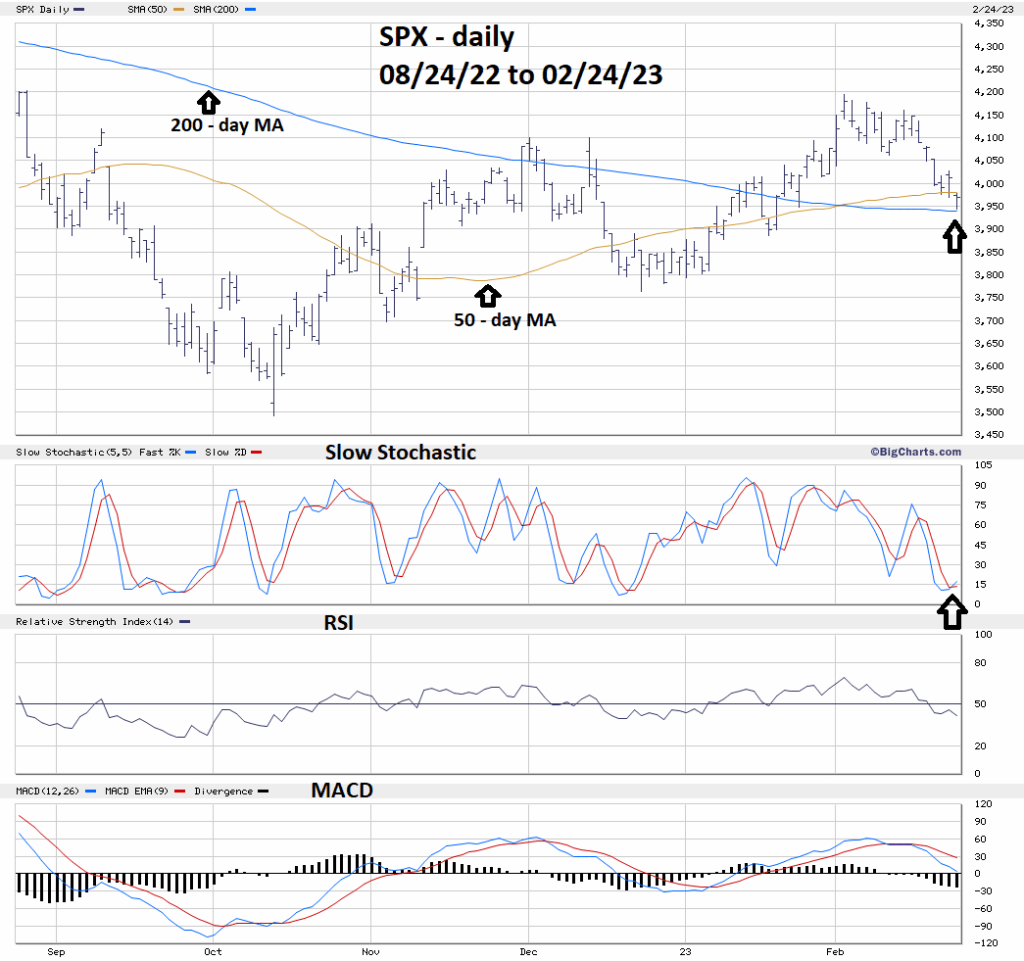
Shortly after the SPX opening on 02/24/23 it reached the 200 – day moving average (MA) triggering a rally that continued throughout the session. Daily Slow Stochastic has a bullish lines cross in the oversold zone. RSI is in the neutral zone with no bullish divergence. Daily MACD is trending lower, and the lines are still above the zero – level. The combined evidence of the three momentum oscillators hint at more downside action.
Also note that the “Golden Cross” signal on 02/02/23 corresponded with the recent SPX price high. The 01/29/23 blog “Potential Golden Cross” noted that the shortest SPX “Golden Cross” signal occurred in 2015. The signal happened on 12/22/15, the SPX then went down before making a new rally high 12/29/15. After that peak the SPX experienced a one – month 12% decline. Perhaps the 02/02/23 signal is a rare bullish fake out.
The daily Dow Jones Industrial Average (DJI) chart courtesy of Trading View shows a potential Elliott wave count.
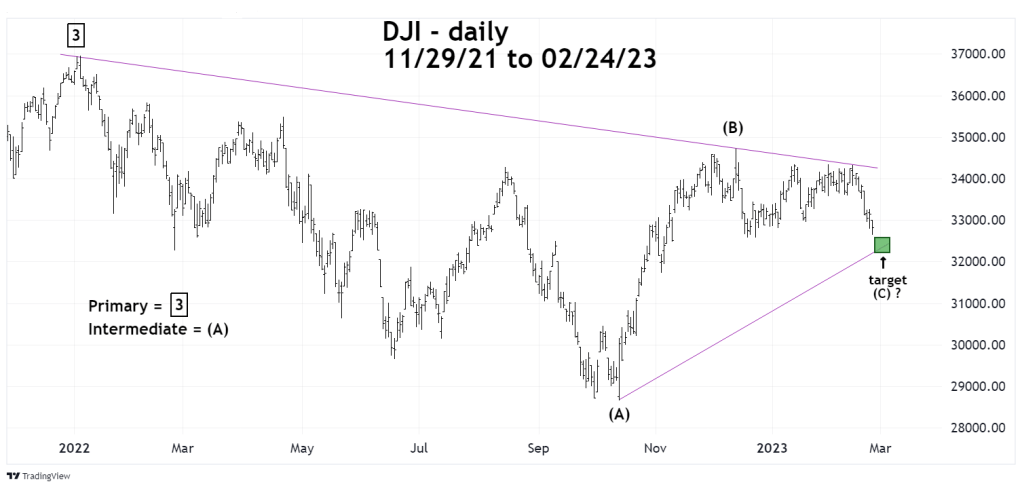
Prior blogs on this site have noted that the DJI from it’s all-time high in January 2022 could be forming an Elliott wave – Horizontal Triangle. Its possible this structure could still be forming with the decline from 12/13/22 top as a developing wave ( C ). If so the size of the presumed wave ( C ) would be proportionate to the presumed waves ( A ) and ( B ).
Sometimes the SPX will go marginally below the 200 – day MA, then resume the rally. The balance of evidence from the momentum oscillators imply this could happen.
If the SPX move below the 200 – day MA is not marginal – perhaps more than 1% below the line, it could be the prelude to a larger decline.
