The prior two blogs examined the long and intermediate – term Elliott wave counts for Gold. The focus now shifts to the Elliott wave action from March 2022 to February 2023.
The daily Gold chart (XAUUSD) courtesy of Trading View illustrates the short- term view.
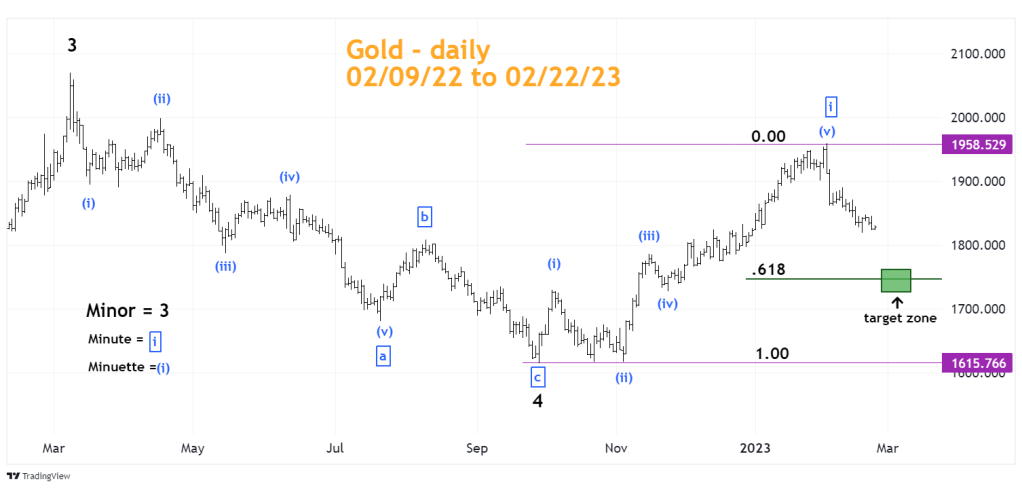
Gold’s decline after 03/08/22 was in the form of an Elliott wave Zigzag correction in which Minute wave “a “ subdivided in a clear five – wave pattern.
One very important factor when analyzing Elliott wave counts. It’s possible to use futures charts for Elliott analysis, but more accurate wave counts are found if there is a cash chart. For example, analyze the S&P 500 chart (SPX) as opposed to the current S&P 500 futures chart – March 2023 S&P 500 – E- mini (ESH2023). The reason for using cash as opposed to the futures is that all futures have amortizing charges within the price which can distort the Elliott wave count.
The chart illustrated is Gold in U.S dollars and it shows the decline from 03/08/22 ended on 09/28/22. On April 2023 Gold futures and the weekly continuous chart, the decline ending on 11/03/22.
The rally after 09/28/22 labeled Minuette wave ( i ) has an impulsive look. Additionally, within an Elliott motive pattern there’s usually a Fibonacci relationship between waves “one” and “five”. In this case Minuette wave ( i ) is .50 of Minuette wave ( v ).
The decline after the 02/02/23 top could go lower. If Gold reaches the target zone near a Fibonacci .618 retracement of the September 2022 to February 2023 rally, it could form an important bottom. There could soon be a fantastic opportunity to buy Gold. Updates will be coming.
