On 12/14/22The FOMC will decide about U.S short – term interest rates. Its expected they will raise rates only .50% as opposed to recent increases of .75%. Whatever the decision is, evidence suggest U.S interest rates could continue to rise for several years.
The daily chart courtesy of Trading View shows the yield curve for U.S government debt instruments.

Normally longer -term debt instruments have higher yields/rates than shorter- term debt.
For example: 30 – year bond 4.00% rate .
10 – year note 3.5% rate
1 – year note 2.00% rate.
The current yield/rate curve for U.S government debt is as follows.
30 – year bond 3.548%
10 – year note 3.566%
5 – year note 3.757%
90 – day bill 4.173%
This is an inverted yield curve and is a very reliable signal of an economic recession coming sometime in the next several months. Stocks discount the future by six to nine months. It’s possible the next bear phase for U.S stocks could begin soon.
The monthly chart of the CBOE 30 – Year Treasury Bond Yield (TYX) shows the long – term history.

In 2022 TYX broke above a multi – decade declining trendline and the prior two bear market rally peaks. This is powerful evidence that the prior 39 – year bear market ended at the March 2020 bottom. The rally since March 2020 is most likely the kickoff phase of a secular bull market that could last several years.
Note that at the recent peak in October 2022, monthly RSI had yet to reach the maximum level recorded in March 1980.
The daily TYX chart focuses on the short-term view.
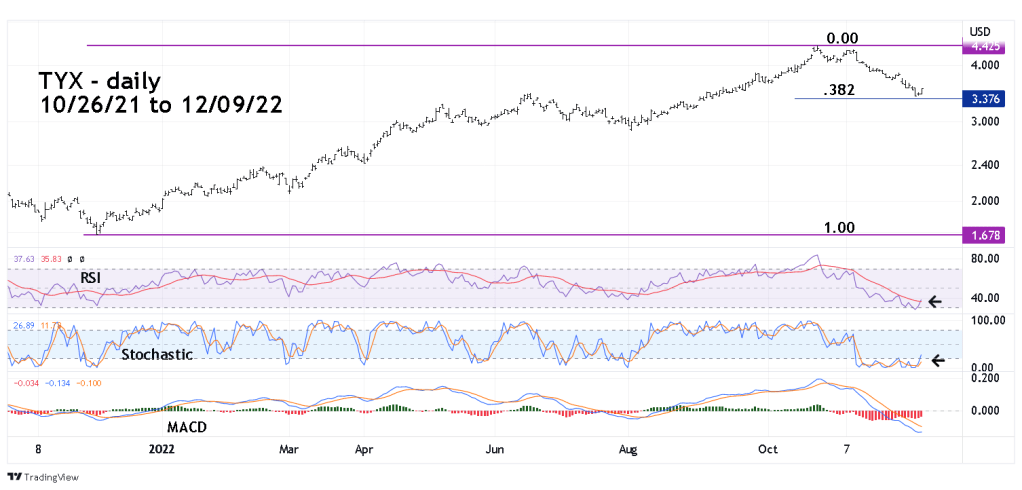
TYX came very close to a .382 Fibonacci retracement of the December 2021 to October 2022 rally.
Daily Stochastic has a bullish crossover coming out of the oversold zone.
The daily RSI has crossed its moving average line after briefly touching the oversold zone.
So far no bullish signal for the daily MACD.
There’s a good chance TYX has begun a new rally that could at least challenge the October 2022 peak.
Recently stock market bulls have been assuming that the FOMC only raising rates by .50% is bullish for U.S stocks. In the short term they could be correct. The stock rally that began in mid -October could continue for several days or a few weeks. However, the long-term outlook for U.S stocks is bearish
In the 1970’s to the early 1980’s the U.S economy suffered through periods of relatively high inflation and rising interest rates. U.S stocks measured by the Dow Jones Industrial Average hit 1,000 in 1966 and was not able to significantly rise above that level until January 1983!
Relatively high inflation rates and rising interest rates are long-term bearish factors for stocks. It’s possible the downturn in US stocks that began in January 2022 could continue into 2025 or longer.
