The previous blog noted that hourly momentum of the NYSE Composite (NYA) was bullish. However, on 12/09/22 the bears were able to overpower the bulls.
The hourly chart courtesy of Trading View shows the turn of the tide.

The 12/08/22 blog illustrated that NYA important resistance was at 15,452.76 on 12/09/22 the NYA failed to move above resistance and turned decisively down. Just prior to the close of the 12/09/22 session, the NYA reached 15,287.76 which is marginally above important support at 15,285.06. If the support is broken it will invalidate the presumed series of “one’s” and “two’s” noted in the 12/08/22 blog.
As of 12/08/22 both hourly RSI and MACD were trending higher after prior bullish crossover signals. On 12/09/22 hourly RSI crossed below its moving average line – a bearish crossover signal.
On the 12/09/22 close the NYA – hourly MACD upper line (blue) was -23.40. The lower line (orange) was -24.12. So far this is not a bearish crossover signal. If the NYA breaks below the important support with an MACD bearish crossover, there’s a high probability prices could continue lower.
The 5 – minute NYA chart reveals an Elliott wave – Horizontal Triangle may be complete.
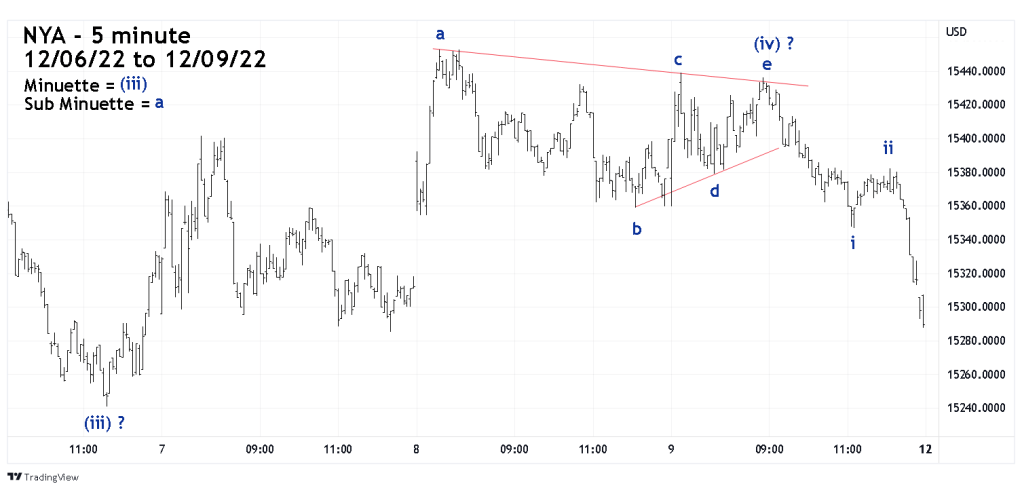
Elliott wave – Horizontal Triangles are corrective patterns of the primary trend, which in this case is down. They are composed of five sub waves each of which sub divide into three wave or multiple three wave structures.
There are usually Fibonacci relationships among the sub waves.
In this presumed Horizontal Triangle, the relationships are as follows.
Sub Minuette wave “c” is close to .382 of Sub Minuette wave “a”.
Sub Minuette wave “d” is close to .618 of Sub Minuette wave “b”.
Sub Minuette wave “e” is close to equality 1/1 of Sub Minuette wave “d”.
A NYA break below the bottom made on 12/06/22 could mean the rally from 10/13/22 to 12/01/22 is complete. If so then US stocks could be in the early part of a down trend that lasts until late 2023.
