The actions of US stocks during the week of 12/05/22 to 12/09/22 demonstrated several fake out moves.
The 12/07/22 blog noted that the S&P 500 (SPX) broke important support at 3,937.64 and that the first wave down of a larger bear move may have begun.
The 12/08/22 blog illustrated that the NYSE Composite (NYA) had a potentially bullish Elliott wave count.
The 12/10/22 blog noted that the NYA failed to break above important resistance and was close to breaking below important support.
Subsequently on 12/13/22 there was a big rally that pushed all three main US stock indices; S&P 500, Dow Jones Industrial Average, and Nasdaq Composite above their respective highs made on 12/01/22.
Fake out moves happen in all markets, there are no certainties in trading/analysis only probabilities. Traders must develop a mental toughness to overcome the frustration of fake out moves. Remain calm and patient, fake out moves are the exception not the rule.
Today 12/14/22 the FOMC announced their decision on U.S short-term interest rates. The initial reaction of US stocks was bearish.
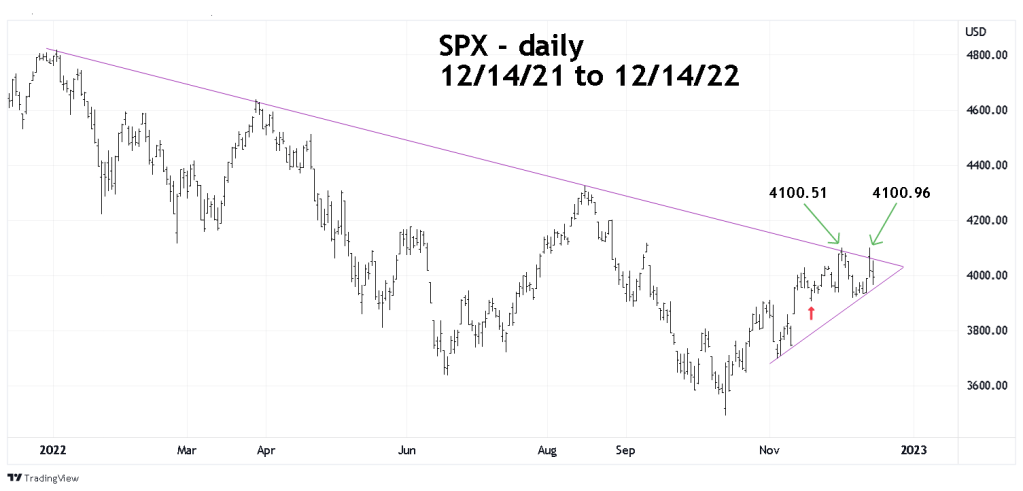
The daily SPX chart courtesy of Trading View illustrates price action from 12/14/21 to 12/14/22.
The bullish factors are as follows.
- Stocks are seasonally bullish in December, if there’s a significant turndown its most likely to occur in late December or early January.
- On 12/13/22 the SPX broke significantly above the declining trendline from the January 2022 top.
The bearish factors.
- Potential double top at SPX 4,100.
- The SPX top on 12/13/22 was 41 – trading days after the 10/13/22 bottom. The 08/17/22 to 10/13/22 decline was 40 – trading days. The 06/17/22 to 08/16/22 rally was 40 – trading days. A potential Fibonacci time ratio of equality of the three market movements.
Important levels to watch are the SPX 12/13/22 top at 4,100.96 and the SPX 11/17/22 bottom at 3,906.54.
