Since 10/13/22 the Dow Jones Industrial Average (DJI) has been the most bullish of the three main US stock indices. In only 21 -trading days the DJI has retraced 62.1% of a nine-month decline. The Golden Fibonacci ratio of .618 or 61.8% is frequently a support/resistance level. With a nearly precise hit of an important retracement level a significant top could now be in place. However, seasonal patterns and statistical evidence imply the rally could continue for several weeks.
Stock markets and in particular, the US stock market is seasonally bullish from November until April with November being the most bullish month of the year.
Statistical data from the DJI provides additional bullish evidence. The 10/29/22 blog “Dow Jones Industrial Average Could Make a New High in 2023” noted an article in the 2023 edition of the “Stock Trader’s Almanac”. The article examines the actions of the DJI during a US mid-term election year and subsequently into the next year. The almanac’s studied the percentage change of the DJI between the mid-term year low and the high in the following year. Of the 27 election years the average DJI gain was 46%. While its possible the DJI could go below its 10/13/22 bottom before the end of 2022 it’s a low probability. Out of the prior 27 election years there have been only 3 instances when the DJI made its low after the election, 3/27 = 11%.
While the average DJI gain is 46%, it’s interesting as to when the smallest gains occurred.
In 1946 the DJI gained 14.5%. This was during the industrial contraction after World War – Two.
In 2014 the DJI gained 19.1%. This was a time of tepid global growth.
In 1978 the DJI gained 21%. An inflationary time in the US.
In 1930 the DJI gained 23.4%. The worst economic depression in US history.
In 1966 the DJI gained 26.7%. The start of an inflationary cycle in the US.
During 2022 the US has experienced the highest inflation rates in over 40 – years. The prior inflationary cycle in the US lasted over 14 – years from 1966 to 1981. It’s unlikely the current inflationary problem will end soon and could continue for several years . There’s a high probability the US could be in a period of inflation and/or recession during 2023. Therefore, the DJI post mid -term year low rally could be less than the average of 46%.
The monthly DJI chart courtesy of Trading View shows two rally projections.
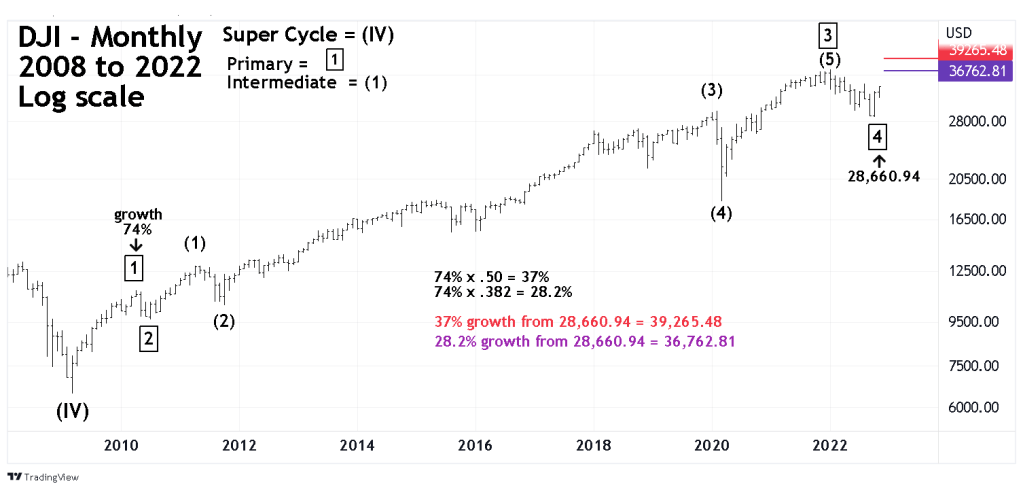
When measuring moves on an index or a stock that’s had a large gain its best to measure growth rates as opposed to points. For example, a DJI 100 – point move is not as significant at the 30,000 level as it was at 9,000.
Within Elliott motive waves there’s usually a Fibonacci relationship between waves “one” and “five”
The growth rate of the DJI presumed Primary wave “1” was 74%
This growth rate multiplied by the Fibonacci ratio of .50 is 37% added to the presumed Primary wave “4” yields a DJI – Primary wave “5” target of 39,26.48.
Another projection, multiplying 74% by the Fibonacci ratio of .382 gets a growth rate of 28.2% added to Primary wave “4” gets a DJI – Primary wave “5” target of 36,762.81.
The 11/12/22 blog “Forecast for US Stock Market Top” noted that the S&P 500 could have a truncated Primary wave “5” that fails to exceed the Primary wave “3” peak made in January 2022. Perhaps the DJI could also have a truncated Primary wave “5”. This post 2022 rally percentage gain would be more in line with the percentage gains made in other years with weak or weakening economies.
One final point, the “Stock Trader’s Almanac” measures from the mid-term year low to the high in the next year. Its possible the DJI – Primary wave high peaks in late December 2022 at perhaps 36,700 declines and opens the first trading day of 2023 at 36,500 and continues dropping and never exceeding 36,500.
Monitor the DJI. If the current rally continues into mid or late December 2022, it could be the signal for a great shorting opportunity.
