Fibonacci Time analysis could be the key to discovering an important stock market peak.
Market movements can sometimes be measured by using Fibonacci ratio analysis for either price or time. For example, a market could have a decline lasting 70 – trading days followed by a rally of 43 – trading days. This would be a ratio of 43/70 or .614 which is close to the Golden Fibonacci ratio of .618.
The 10/15/2 blog “Fascinating Fibonacci Price and Time Relationships – 10/14/22” noted a potential Fibonacci time ratio for the S&P 500 (SPX).
The daily SPX chart courtesy of Trading View illustrates the time ratio.
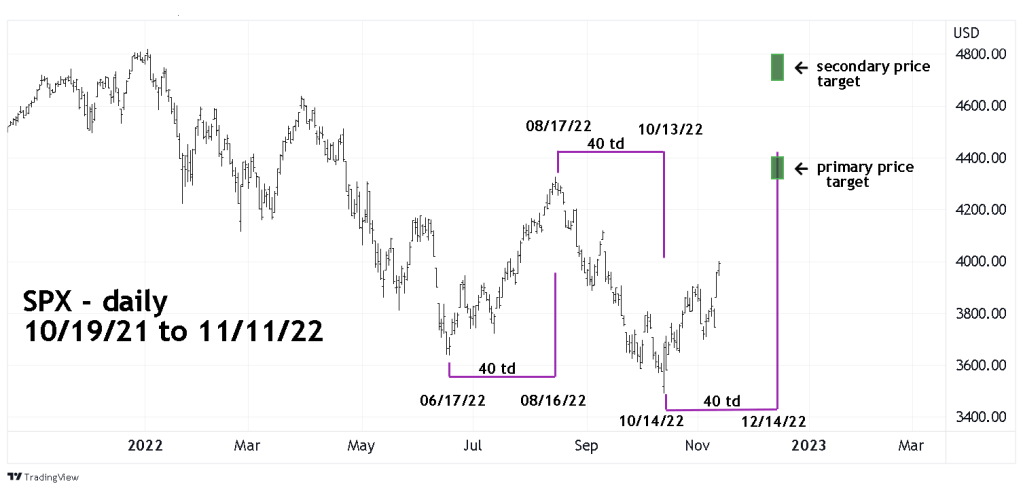
We can now see that the Fibonacci time ratio of equality was successful in targeting 10/13/22 as an SPX bottom.
There are two potential Elliott wave counts that could be in effect. An Expanding Flat could be developing from SPX 06/17/22 bottom. In this count the 06/17/22 to 08/16/22 rally was wave “A” of the Expanding Flat. The 08/16/22 to 10/13/22 decline is wave “B”. The rally after 10/13/22 would be a developing wave “C”.
The other potential Elliott wave count has the 10/13/22 SPX bottom as Primary wave “4” of a developing five wave extended impulse from the March 2009 bottom. Please see the 10/29/22 blog “Dow Jones Industrial Average Could Make a New High in 2023” for a detailed explanation of this theory.
Wave “C” in Expanding Flats subdivide into five waves either an Impulse wave or an Ending Diagonal Triangle. Primary wave “5” would also sub divide into an Impulse wave or an Ending Diagonal Triangle. Each rally after 10/13/22 is the same except that in the Expanding Flat – wave “C” would not exceed the all-time SPX high made in January 2022.
After the completion of either wave “C” or Primary wave “5” there’s a high probability that the next decline could go below the SPX bottom made on 10/13/22.
Assuming the same Fibonacci time ratio is still in effect – adding 40 -trading days from the 10/13/22 bottom targets 12/14/22 as a potential rally termination point. Using a leeway of two trading days plus or minus, targets the week of 12/12/22 to 12/16/22 as a broader time zone.
The primary SPX price target favors the Expanding Flat wave count. Wave “C” in an Expanding Flat marginally exceeds the termination points of wave “B”, in this case the 08/16/22 peak.
The secondary SPX price target favors the Primary wave “5” count. Because the SPX post 10/13/22 rally is much weaker than the Dow Jones Industrial Average (DJI) the SPX Primary wave “5” could be truncated. This occurs when the fifth wave fails to exceed the termination point of the third wave, in this this case the SPX 01/04/22 all-time high.
Of the three main US stock indices the DJI has the best chance of exceeding its January 2022 top. The next blog will examine where the current DJI rally could terminate.
