Today, 11/17/22 the S&P 500 (SPX) had some fascinating intraday reversals that could give hints to the broader trend.
The 15 – minute SPX chart courtesy of Trading View illustrates the price action since the 10/13/22 bottom.

Note that the SPX low on 11/17/22 was just above a Fibonacci .236 retracement of the 10/13/22 to 11/15/22 rally. In bull moves a .236 retracement is typical of fourth waves of Elliott impulse patterns. Shallow retracements of bull moves come after dynamic third wave rallies. There’s profit taking, then bulls eager to participate in the up move – quickly establish or add to long positions.
The 5 – minute SPX chart provides greater detail about the intraday action.
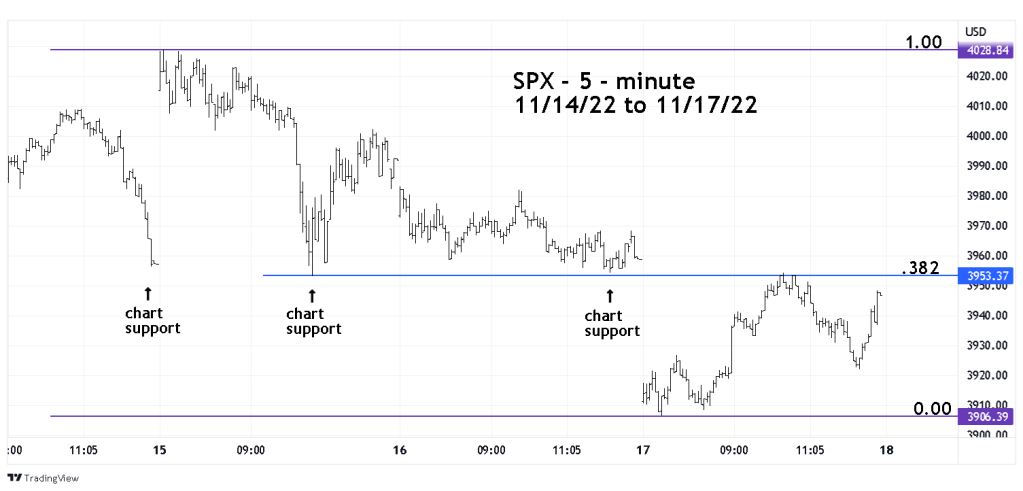
Between 11/14/22 and 11/16/22 the bears made several attacks in the 3952 to 3956 area creating a triple bottom. Futures trading after the close of the SPX 11/16/22 session were successful in breaking the support and created an SPX gap down open on 11/17/22.
Note that the subsequent rally after the 11/17/22 bottom there was a Fibonacci .382 retrace of the drop from 11/15/22, and the SPX rally high was almost at the same level of the 11/15/22 bottom. This is a perfect example of prior support becoming resistance.
After hitting the resistance, the SPX declined but failed to make a new low. Then late in the session, the bulls had another rally that came close to the prior high.
A move above the 11/17/22 high of the day could open the door for a powerful rally. However, there could be one more bearish obstacle for the bulls to overcome.
The 30 – minute December S&P 500 futures chart (ESZ2020) illustrates the Volume Profile indicator.
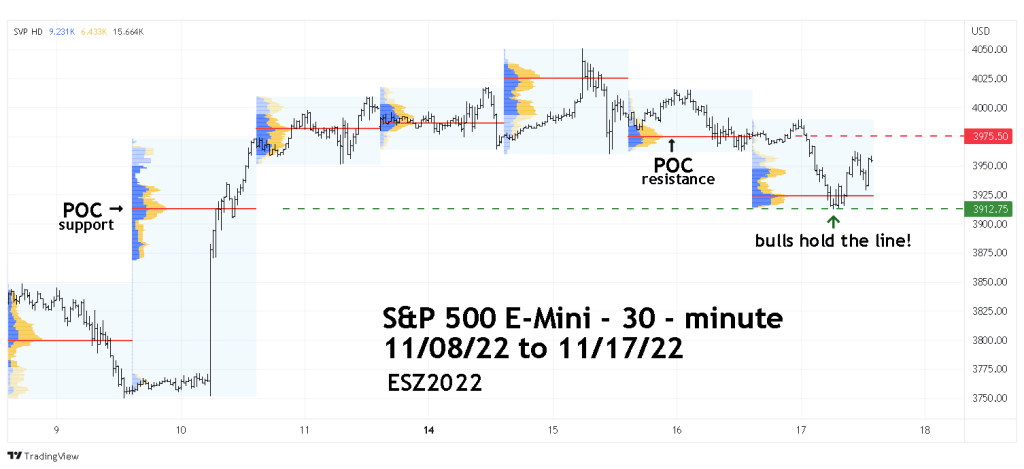
The Volume Profile indicator shows volume on a vertical axis with the volume corresponding to price action. The widest part of the Volume Profile is called the Point of Control (POC), it indicates the greatest area of buyers/sellers.
Note that the 11/17/22 bottom was exactly at the POC level of the 11/10/22 session, that’s the area of greatest demand.
If the 11/17/22 support is broken it could open the door for a move down to the low 3800 area.
Note the next POC resistance is at 3976, this corresponds to about 3967 on the SPX. If the POC resistance is broken it could open the door for a move back to the 11/15/22 high.
Another factor favoring the bulls is the calendar. November is seasonally the most bullish month for stocks, and frequently the upward trend can continue until the end of the year.
If the SPX can break above the 11/15/22 peak it could reach the area of the 08/16/22 top before the end of November 2022.
