Never underestimate the persistance of a stock bull market or a stock bear market rally.
To gain a perspective on the persistence of a stock bull market we need to examine the secular US stock bull market that lasted thirteen years from October 1987 to March 2000.
The monthly S&P 500 (SPX) chart courtesy of Trading View illustrates the action.
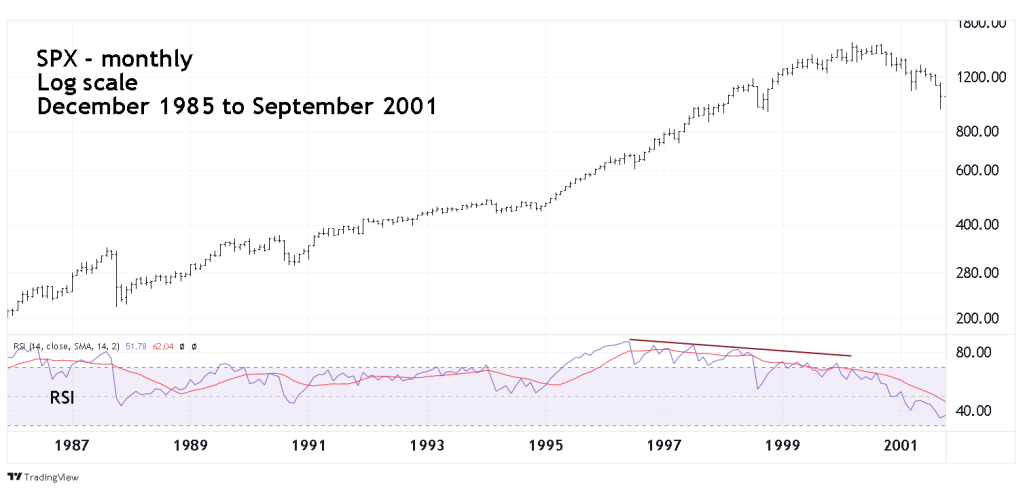
The monthly RSI hit its maximum level in June of 1996, yet the SPX bull market continued for almost four- years. The monthly RSI had six bearish divergence before the final SPX top in March 2000 – which is incredible! Many bears probably lost a lot of money, and their minds trying to short stocks from 1996 to 1999.
The daily SPX chart focuses on the ultimate top in 2000.
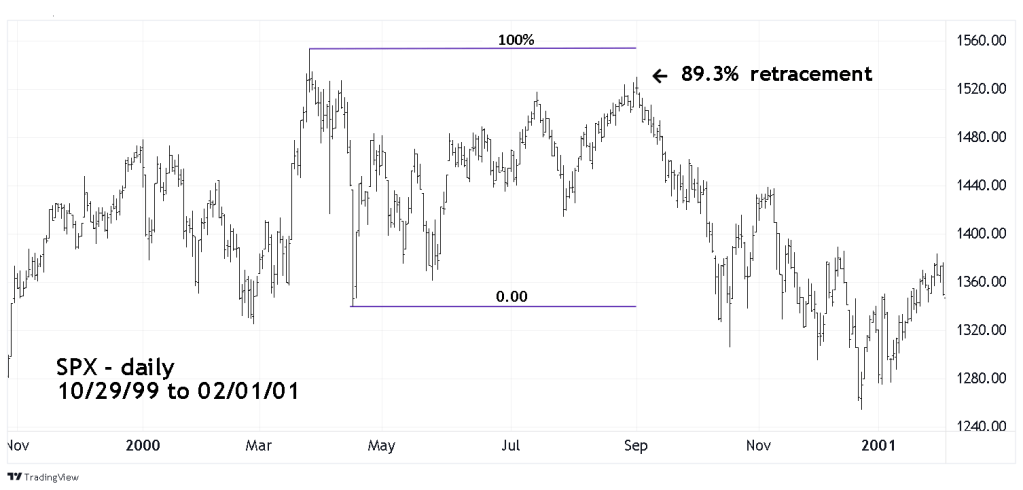
Even after the ultimate SPX top, in the face of deteriorating economic fundaments, the bulls as late as September 2000 came close to a new all-time high.
The technology laden Nasdaq Composite had a significant drop after its March 2000 top as the tech stock mania burst. The bears shorting that sector had success, however up until September, it was still a world of pain attempting to short most other stock sectors.
The weekly SPX chart examines action since 2021.
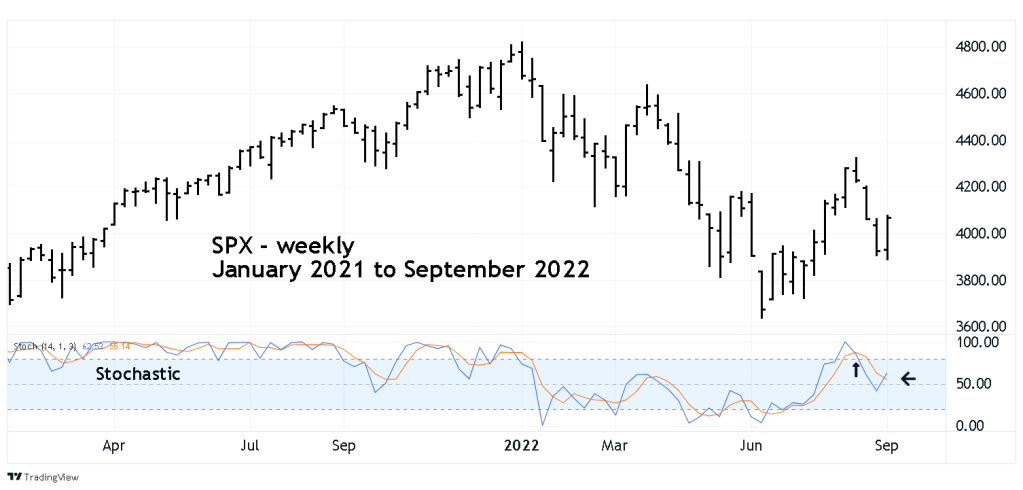
After the 08/16/22 peak the SPX weekly Stochastic had a bearish lines crossover implying a new bear market down wave may have begun. However, last weeks up move triggered a bullish lines crossover which opens the door for a possible multi-week rally.
The daily SPX chart from late 2021 looks at three potential bearish obstacles.
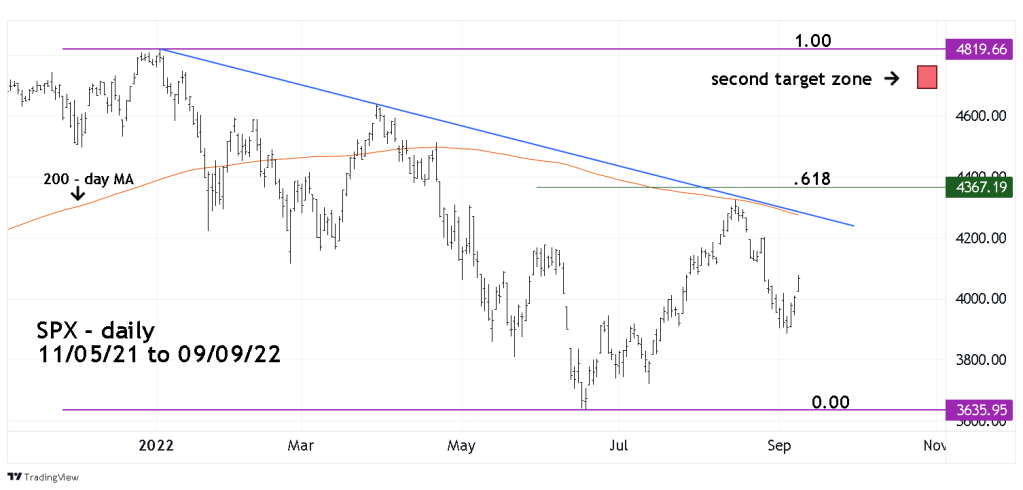
There are three factors the stock bulls need to overcome. The daily 200- day moving average (MA), the declining trendline from the January 2022 top, and the .618 retracement of the January to June decline.
The SPX moving above all three of these potential obstacles could be a significant event. Possibly triggering short- covering and bringing new purchases to the long side. This could propel the SPX up to the next significant resistance area – near the January 2022 top.
Its possible the SPX could form a double top in 2022 similar to what happened in 2000.
Keep an open mind and be prepared for any contingency.
Never underestimate the persistence of a stock bull market or a stock bear market rally.
