The S&P 500 (SPX) turn on 09/06/22 appears to be the beginning of at least a multi- week rally. Daily momentum indicators provide guidance to determine the first upside target.
The daily chart courtesy of Trading View illustrates three external momentum indicators.

The daily Stochastic has a bullish lines crossover and has yet to reach the overbought zone above the 80% line, implying more upside action Note that after reaching the overbought zone Stochastic could stay in that area for several trading days.
The RSI has a bullish crossing of its moving average line. Several blogs noted that the SPX recent high on 08/16/22 came with the daily RSI at it highest level of the 06/17/22 to 08/16/22 rally. The vast majority of the time, stock index peaks occur with at least one RSI bearish divergence. If in the current rally the SPX exceeds its 08/16/22 high with a daily RSI bearish divergence it could be signaling an important top.
So far, the MACD does not have a bullish lines crossover. A near-term crossover increases the probabilities for further upside action
The 5 – minute SPX500 – Point & Figure (PF) chart illustrates short-term resistance levels.
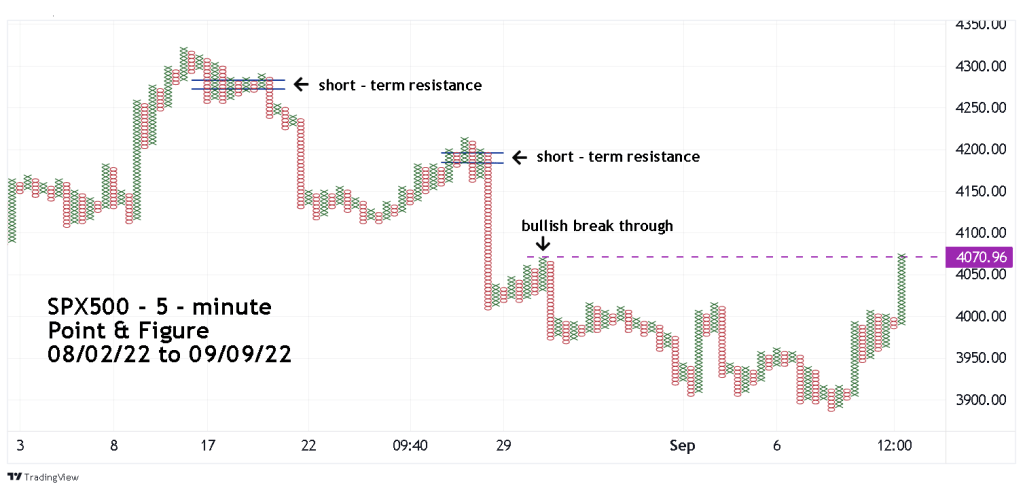
Trading View has a stock index called SPX500 – symbol SPX500. It’s similar to S&P 500 continuous futures except its price very close to the SPX. The SPX500 is good at revealing potential support and resistance areas outside of SPX trading hours.
The PF chart shows it broke above resistance and there’s no significant chart resistance up to 4160. Maximum potential resistance is near 4185.
The next potential resistance begins near 4270.
These two chart clusters are the main obstacles to a move above the SPX 08/16/22 top.
The first SPX target zone is from just above the 08/16/22 peak to the area around the 04/21/22 top.
It’s possible the SPX could exceed the first upside target area. The next blog will examine why the SPX could rally beyond the 04/21/22 peak.
