From 09/06/22 to 09/12/22 US stocks had a strong and steady rally. Then in two trading days the move up was nearly wiped out. The first phase of a larger developing decline? An examination of momentum indicators argue against this theory.
In stock bull markets rallies are normally slow and steady. Declines usually don’t exceed a Fibonacci .618 retracements. Bear market rallies are different – retracements of both up and down moves can frequently exceed .618 retracements
The 09/11/22 blog “S&P 500 – Second Upside Target” illustrated the S&P 500 (SPX) early bear market action after March 2000 major peak.
The daily SPX chart courtesy of Trading View shows a series of deep retracements after March of 2000.

The first two movements show deep retraces of the March and April 2000 initial moves down. In the subsequent declines the bears pushed deep into the prior rally. Rallies labeled # 5 and # 6 both looked like great set ups for a resumption of the bear market. The rallies frustrated the bears and they had to wait until September 2000 for an effective shorting setup.
The hourly SPX Trading View chart illustrates an external momentum indicator.

At the SPX 09/14/22 low the SPX had retraced 89% of the 09/06/22 to 09/12/22 rally. There was an RSI bullish divergence vs. the low made on 09/13/22. The hourly RSI also moved above its moving average line. Both of these bullish factors imply at least a multi- hour rally.
The StockCharts.com chart illustrates internal US stock market momentum.

The US New Highs minus New Lows (5-day total – end of day) StockCharts.com symbol ($USHL5) was shown in the 09/04/22 blog “Rally and Retracement”. This updated chart shows that subsequently the index went slightly lower then rallied after 09/06/22.
Amazingly during the 09/13/22 drop this indicator went up!
The StockCharts.com daily chart shows the S&P 500 cumulative Advance/Decline line symbol ($SPXADP).
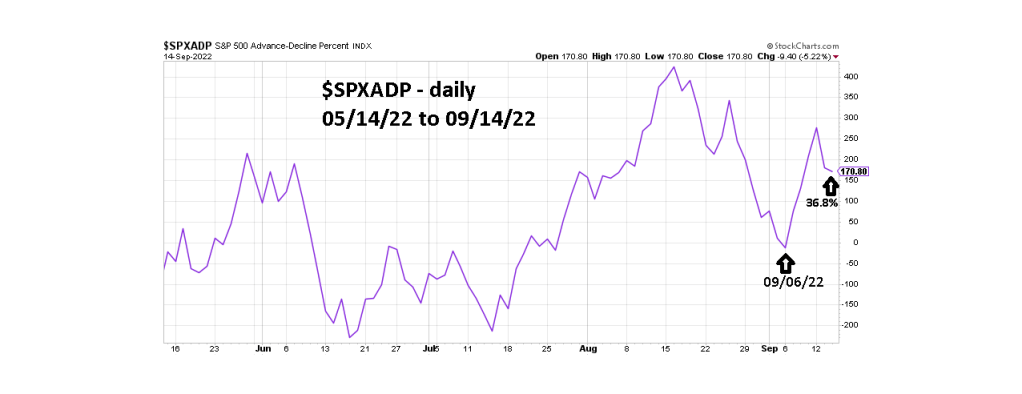
Measured from closing prices the SPX on 09/14/22 had retraced 81.2% of its rally from 09/06/22 to 09/12/22. $SPXADP at the 09/14/22 close had retrace only 36.8% of its 09/06/22 to 09/12/22 rally.
The internal momentum indicators should be at least matching or exceeding price action. The bullish divergences imply that the rally that began on 09/06/22 will probably continue.
The next potentially big market moving event is the FOMC meeting on 09/21/22, there’s a good chance US stocks could rally into at least 09/20/22.
Never underestimate the persistence of a stock bull market or a stock bear market rally.
