Today 08/03/22 the S&P 500 (SPX) had a high of 4167.66 just below a double top made on 06/02/22 and 06/06/22.
The hourly SPX chart courtesy of Trading View illustrates the action.
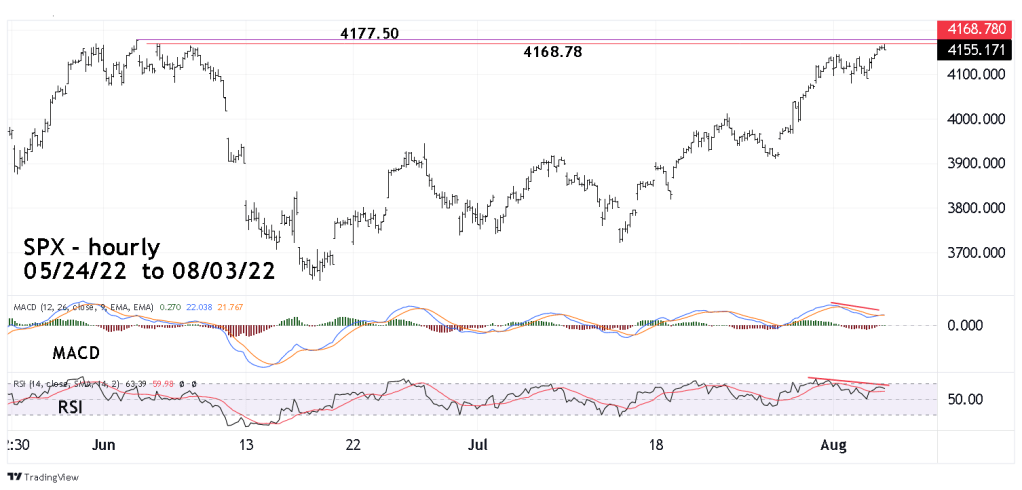
Both the hourly RSI and MACD have bearish divergences.
Its possible a short-term top could be in place at the 08/03/22 high of the day.
If not there could be a brief marginal rally just after the SPX session on 08/04/22.
A decline could last a few trading days.
