The 05/29/22 blog “UK 100 Could Soon Make an All-Time High” noted how close the UK 100 (UKX) was to making a new 2022 high and possibly an all-time high. Two – trading days later the UKX peaked just below its April top, then declined through most of June.
Subsequently on 07/14/22 UKX made a double bottom with its 06/17/22 low and has rallied since then.
The daily UKX chart courtesy of Trading View updates the action.
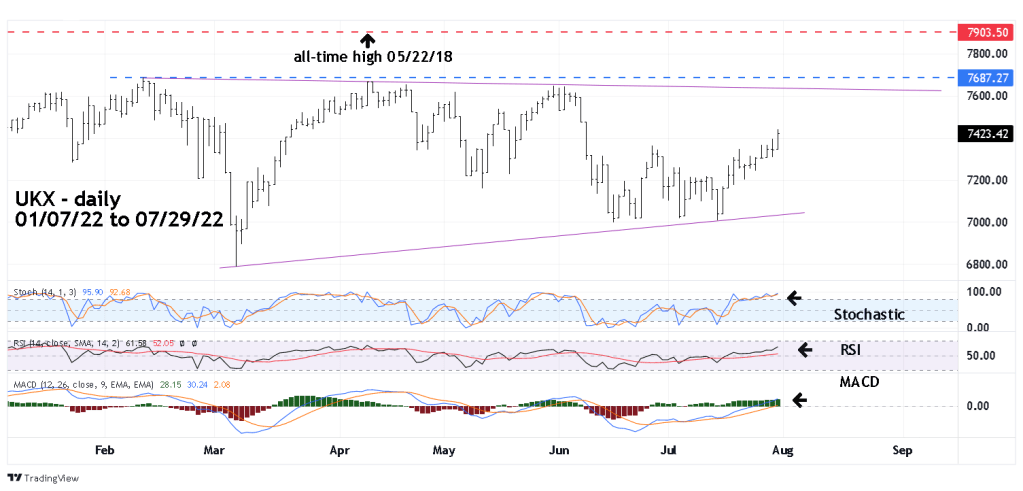
On 07/29/22 UKX was only 3.5% below its 2022 peak made on 02/10/22 and 6.5% below its all-time high made on 05/22/18. Seasonal stock patterns are bullish in August. If the UKX can make a new 2022 high it could be the only major national stock index to reach this summit. If so, it could be a significant non confirmation with most of the world.
Another factor to consider is the declining trendline connecting the February and April 2022 tops. This could act as resistance for the current rally.
The UKX making a new all-time high could possibly be bullish, based on the longer-term momentum and sentiment evidence its more likely a new all-time could be a non-confirmation signal.
The daily UKX momentum indicators are in a similar position to the SPX daily momentum which were examined in the 07/30/22 blog “Market Fuel Gauge”. Just like the SPX the momentum implies more upside action in August.
Even if you don’t trade the UKX or stocks within the index, this is a must watch market in August 2022.
Any information from this sites UK followers as to why the UKX is outperforming the world would be greatly appreciated.

The FTSE was already very cheap versus other global markets so some relative re-rating was probably due anyway. However, as an index, it is very energy heavy and obviously oil stocks have done very well for obvious reasons. And there is also a high banks component which should do relatively well in a rising interest rate environment. It is the perfect index for an inflationary, high energy price environment.
LikeLike
Hi Sam
Thanks very much, this information very helpful.
Mark
LikeLike