Almost all markets have seasonal tendencies, for stocks September to October are usually bearish. A review of important stock market tops reveals what can occasionally happen during the September to October time frame.
The daily Dow Jones Industrial Average (DJI) chart courtesy of Trading View illustrates the infamous 1929 stock market crash.

The first trading day of September 1929 was the peak of an incredible bull market that lasted from 1921 to 1929. While the worst part of the crash occurred in October, the move down was so powerful the bottom wasn’t in place until early November 1929.
Anyone selling stock holdings in August 1929 avoided a disaster. Anyone shorting stocks in August 1929 was able to reap an abundant harvest of profits.
The daily DJI chart illustrates a powerful drop made in 1937.

This stock smashing came after a secondary peak made in August 1937. Note when the secondary rally began, 06/17/37. Look familiar? The recent January to June 2022 drop bottomed on 06/17/22. On 08/16/37 the daily RSI was in the overbought zone with a small bearish divergence. So far in the current rally from 06/17/22 the daily RSI has yet to reach the overbought zone.
The 39% August to October 1937 decline was the most dynamic part of what would become a five – year bear market! Again, selling stocks in August was the right course of action.
The daily S&P 500 (SPX) chart shows what happened in the 1987 stock market crash.

August 1987 was the high point of a powerful five – year bull move that began in August 1982.
The subsequent 35% drop into October 1987 again displays the importance of selling in August.
The daily SPX chart shows a double top that occur in 2000.

March 2000 marked the end of a thirteen – year secular bull market that began in October 1987. After an initial one – month sell off the SPX rallied, retracing almost 90% of the March to April 2000 drop. The secondary peak came on 09/01/00. The subsequent September to October 2000 -14% drop was the start of a bear phase that didn’t end until October 2002.
March 2000 was the best time to sell the SPX. August 2000 provided another selling opportunity.
The next daily SPX chart shows the 2007 to 2009 bear market.
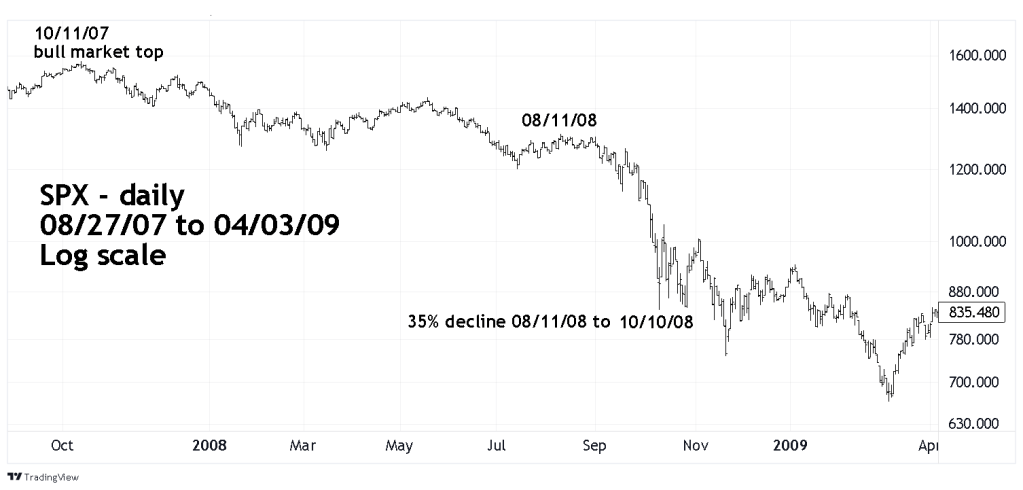
The August to October 2008 was the most powerful portion of the seventeen – month bear market. The 35% decline from 08/11/08 to 10/10/08 matched the 35% drop made in the 1987 crash and the 35% SPX 2020 crash.
August 2008 was not the best time to sell stocks, nor was it the second-best time to sell. It was, however, the last chance to avoid a portfolio smashing drop.
Long – term sentiment and momentum evidence for US stocks strongly suggest that the end of the powerful thirteen-year secular bull market that began in March 2009, may have terminated in January 2022. If so, the current August 2022 stock market rally could be the secondary peak in a larger developing bear market.
While near-term the stock rally could continue, its important to be prepared for what may happen after August 2022.
It’s possible stocks could be on the verge of a historically large decline.
