In the short – term the Philippine Stock Exchange Index (PSEI) has been relatively weaker than the S&P 500 (SPX). The SPX recent bottom came on 06/17/22, the PSEI didn’t bottom until 06/23/22. On 07/15/22 the PSEI appeared to be on track to make a new 2022 low, the rally on 07/18/22 appears to have halted the decline.
The daily PSEI chart courtesy of Trading View updates the action.
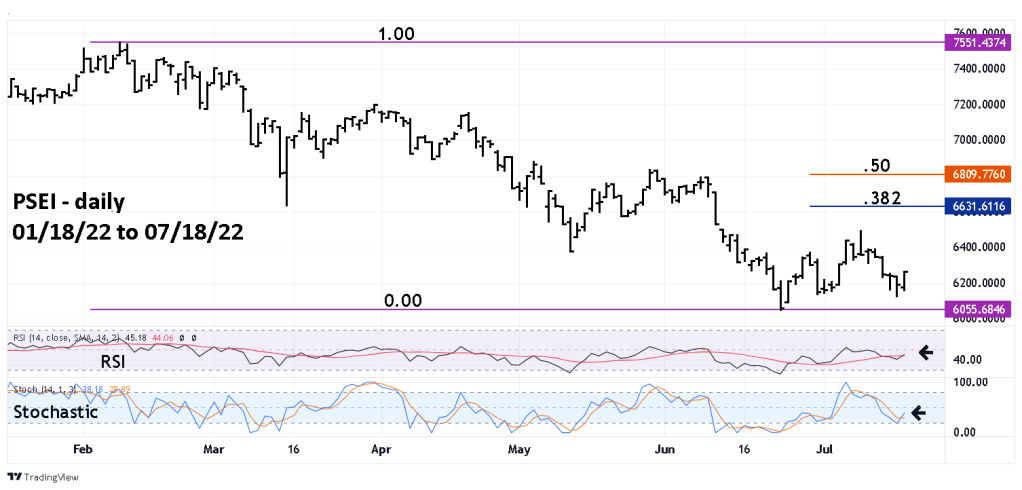
Daily RSI again crossed above its moving average line. Daily Stochastics had an additional bullish lines crossover. These bullish signals imply the rally could continue for at least one week, possibly longer. Upside targets are a .382 retracement of the February to June decline near 6630. A higher possible target is at a .50 retracement near 6810.
The PSEI 15 – minute chart reveals additional bullish evidence.

The presumed Minor wave “B” looks like a completed Elliott wave Expanding Flat correction.
Within Expanding Flats – wave “a” is usually related to wave “c” by the Fibonacci ratio of .618.
The presumed Minute wave “a” is 234.69 points.
The presume Minute wave “c” is 370.71 points.
The ratio is 234.69/370.71 equals .633.
This wave count is invalid on a break below the 06/23/22 bottom at 6054.79.
