The S&P 500 (SPX) high on 07/19/22 was 3,939.81, just below a double peak. If the SPX can decisively break above this resistance it could open the door for a move up to the 4,100 area.
The SPX – 15 – minute chart courtesy of Trading View illustrates the action.
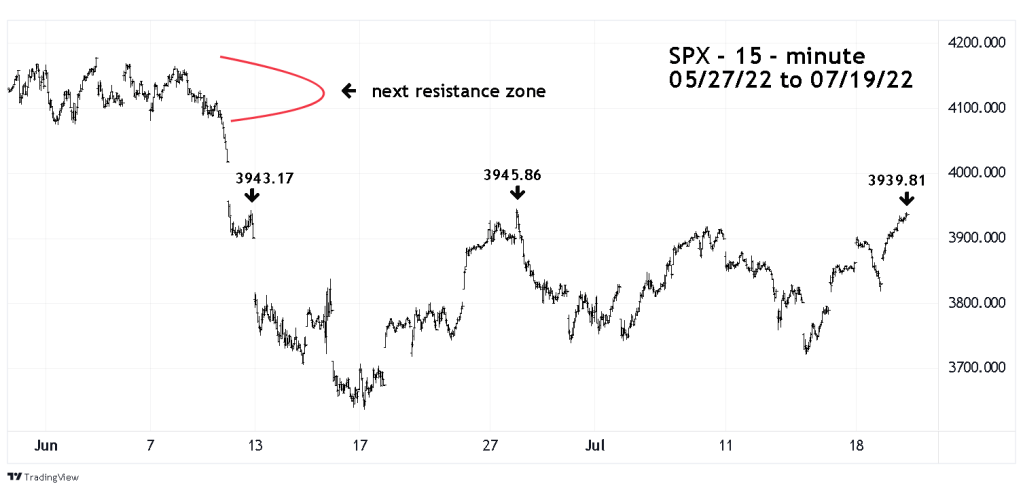
On 06/10/22 the SPX made a peak at 3,943.17, subsequently on 06/28/22 the SPX marginally broke this level at 3,945.86 then declined sharply. If the SPX can strongly break this double top there’s no chart resistance until the 4,080 to 4,170 zone.
The daily SPX chart updates the momentum status.
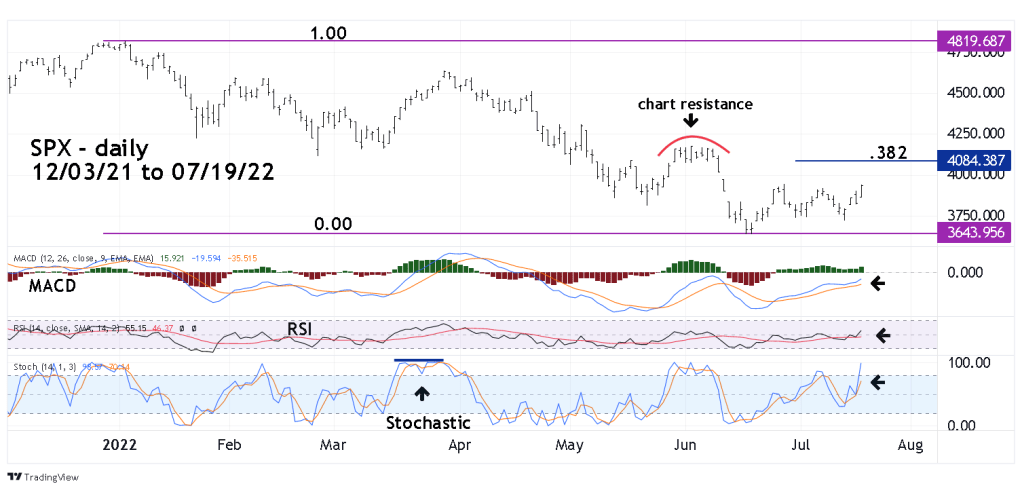
Daily MACD is not overbought and still below the “zero” line. The daily RSI is still not overbought. Stochastic – a more sensitive indicator has one line in the overbought zone. Note that both lines could hold above the overbought zone for an extended time. In late March daily Stochastic remained overbought for two weeks. If the situation were to repeat the SPX daily Stochastic could be overbought into at least early August. The bullseye termination date for a possible multi-week SPX rally is 08/22/22.
If the SPX can decisively break above the double top, all of the daily momentum indicators may not be overbought until sometime in August.
