From January to June 2022 the three main US stock indices were in a steady downtrend creating an oversold condition. Could July 2022 also be another down month for US stocks? Evidence continues to suggest a multi-week rally is developing.
The monthly S&P 500 (SPX) chart courtesy of Trading View illustrates long-term momentum.
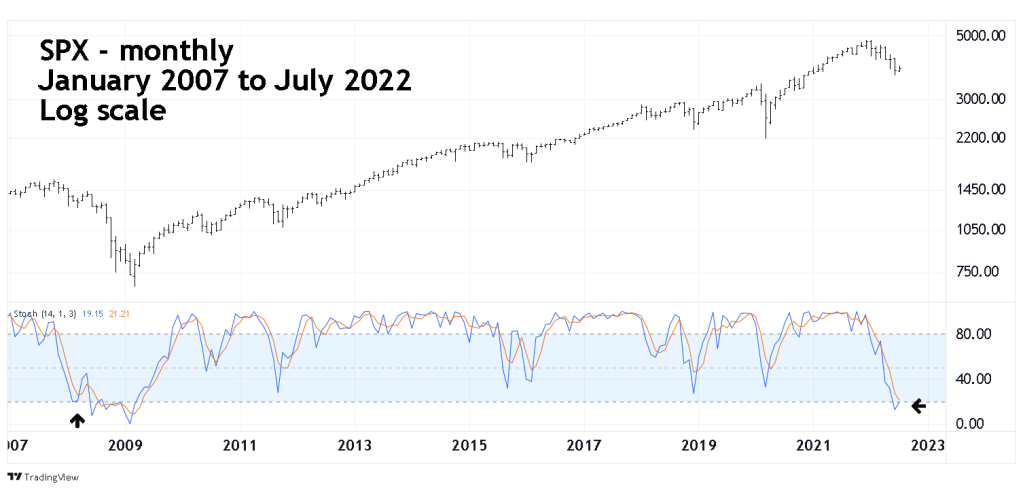
This chart is an update to the monthly SPX chart illustrated in the 07/07/22 blog “ Long-Term Momentum Implies a Multi-Week Rally”. As of 07/07/22 the monthly Stochastic had a marginal bullish lines cross over. Subsequently the SPX declined – negating the crossover.
When trading and analyzing the markets we work with probabilities, not certainties. Near- term the SPX could make new 2022 lows pushing the monthly Stochastic deeper into the oversold zone. However, when you have one Stochastic line in the oversold zone and the other on the edge of oversold, the probabilities favor a bottom forming.
The daily SPX chart illustrates the action since the beginning of 2022.

The prior week had a bullish lines crossover on the daily Stochastic and the RSI had a bullish crossover of its moving average line.
The 07/07/22 blog noted that the SPX could rally into a top on 08/22/22, the current chart shows a broad topping zone from SPX 4070 to 4250.
The SPX – 15 – minute chart zooms in on the most recent activity.

The 07/13/22 blog “A Full Moon and Trendlines” noted a Full Moon on 07/13/22 could correspond to an SPX bottom. The leeway I used for potential lunar turn signals is plus or minus two trading days. The SPX 07/14/22 low is within the time zone for a potential turn.
On 07/13/22 the SPX opened the session with a gap down on news that the US Consumer Price Index – year over year was 9.1%. On 07/14/22 the SPX opened the session gap down on news that the US Producer Price Index – year over year was 11.3%. Both of these reports were higher than the forecasted numbers and very bearish for US stocks. Yet at the close of the 07/15/22 session the SPX was above the level it closed at on 07/12/22 – before the reports.
No additional downside follow through after these bearish reports implies at least a short-term rally is developing. In fact, the SPX has as of the close on 07/15/22 – made no downside progress since 06/13/22. Anyone that went short the SPX on 06/13/22 had a losing position on 07/15/22. That’s more than one – month, the time factor alone could be making stock bears nervous, causing short covering and additional fuel for higher prices.
Very short-term, note the bearish divergence on the 15- minute RSI, it implies the SPX could trend down on 07/18/22.
If the rally continues it could be a slow and choppy rise.
