Today 05/02/22 the S&P 500 (SPX) went below its 02/24/22 bottom eliminating the bullish divergence of only the Nasdaq Composite (IXIC) making new decline lows. While eliminating the bullish divergence there are others made by the new SPX low.
The combined daily SPX and VIX chart courtesy of Trading View illustrates the bullish divergences.

The first bullish divergence was made by the SPX daily RSI, note it is above the level recorded at the SPX 04/26/22 bottom, and above the level recorded at the SPX 02/24/22 bottom. The SPX 05/02/22 low at 4062.51 almost reached the 05/19/21 bottom at 4061.41.
There where two bullish signals made by the VIX. The VIX 05/02/22 high was more than 20% above its 10 – day moving average (MA), which usually implies the VIX could be at or near a climax. Also note that so far the VIX is still below the levels recorded at the SPX bottoms made on 01/24/22 and 02/24/22 bottoms. This implies on a monthly basis the panic is subsiding. Of course, the VIX could go higher. The VIX 05/02/22 high was 36.64, VIX reached 85.47 in March 2020.
Internal momentum indicators continue to show the bears are losing power. So far the IXIC has been the weakest of the three main US stock indices. IXIC is down 24.6% from its all-time while the SPX is down only 15.7%.
The daily Nasdaq New – 52 – Week Lows ($NALOW) chart courtesy of StockCharts.com updates the action of this internal momentum indicator.
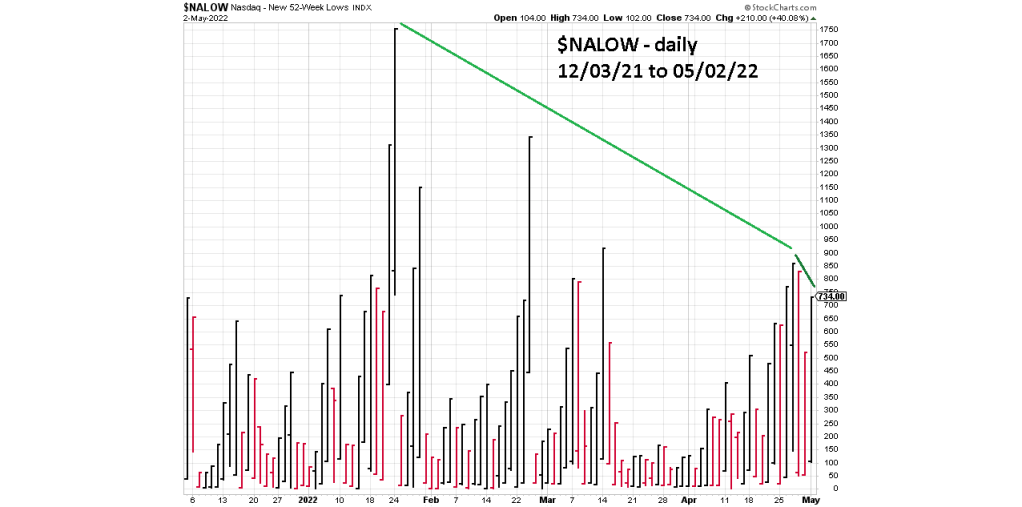
New Nasdaq 52 – Week lows are still below the level reached at the IXIC 04/27/22 bottom.
The Nasdaq 100 – Bullish Percent Index ($BPNDX) chart confirms the bullish evidence of the new Nasdaq lows.

The $BPNDX is above the level recorded on 04/27/22 which was well above the level reached at the IXIC – 02/24/22 bottom.
Today traders were stopped out of half of a 50% position of non – leveraged SPX related funds initiated at the SPX open on 04/29/22. The stop level was SPX 4114.65. The total price move from the 04/29/22 entry was 3.2%. The loss on half of a 50% position was .80%.
Near-term bearish sentiment readings could be at an extreme. Intermediate – term bearish sentiment is decreasing, while less stocks are making new lows. These are the signals seen at or near significant bottoms.
US stocks could be on the verge of a multi -week rally that could push back to at least the all-time high.
There could be another opportunity to enter long positions very soon. I will have a blog after the SPX session closes on 05/03/22.
