On 04/29/22 the US Stock market represented by the three main stock indices; S&P 500 (SPX), Dow Jones Industrial Average (DJI), and Nasdaq Composite (IXIC) wiped out a powerful rally made on 04/28/22. Could this be the start of a crash? Perhaps, anything is possible. However, a review of momentum and sentiment readings for US stocks on 04/29/22 reveal some fascinating clues.
The daily SPX,DJI, and IXIC chart courtesy of Trading View updates the price action of these indices that was illustrated in the 04/28/22 blog “Examination of the Weakest US Stock Index”.
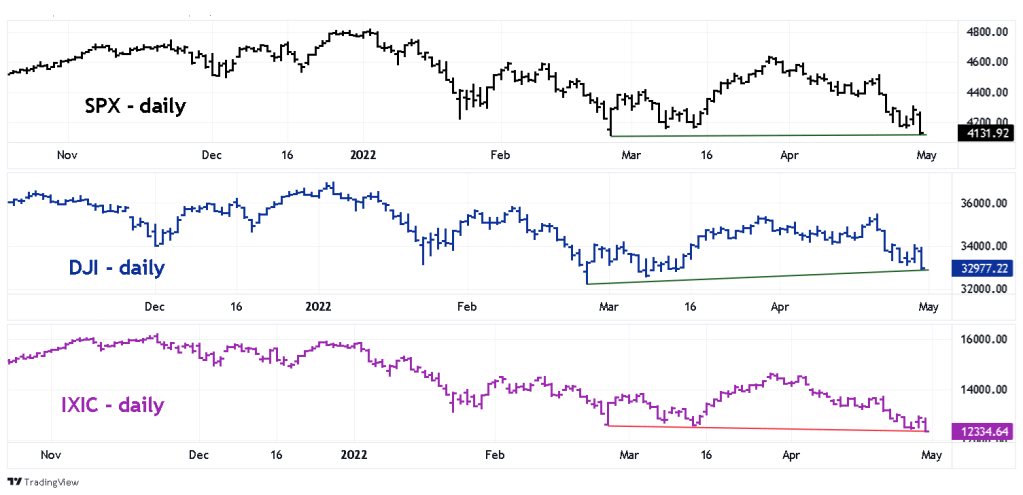
So far the IXIC is still the only index of the three to make a new 2022 decline low. I call this a “Rule of the majority” signal – in this case the two non-confirming indices are bullish divergences.
The daily Nasdaq New – 52 – Week Lows chart ($NALOW) courtesy of StockCharts.com illustrates incredible data.

As the Nasdaq goes lower, there are less stocks making new – 52 – week lows. This phenomenon continued into 04/29/22 with less new lows than were recorded at the 04/27/22 bottom.
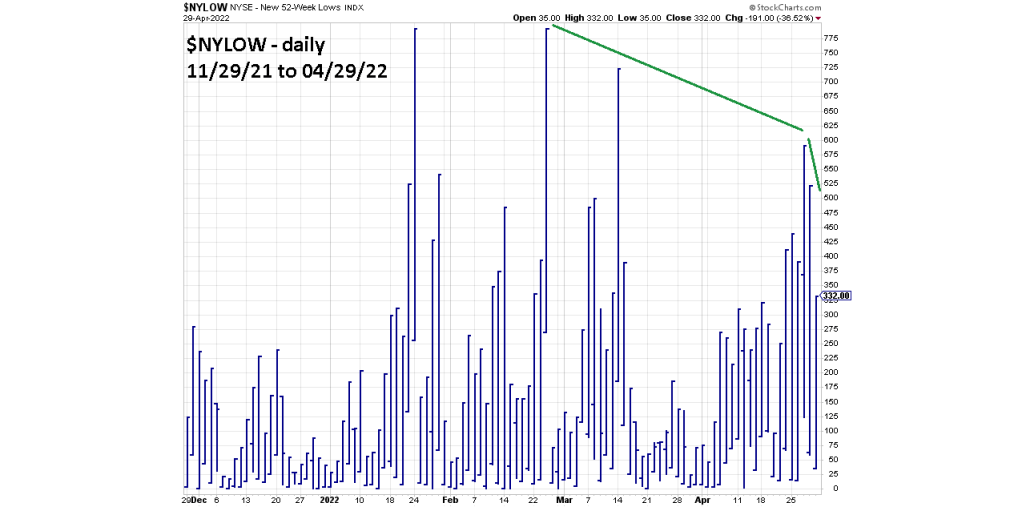
The chart for NYSE New -52 – week Lows ($NYLOW) confirm the Nasdaq readings.
But wait – there’s more.
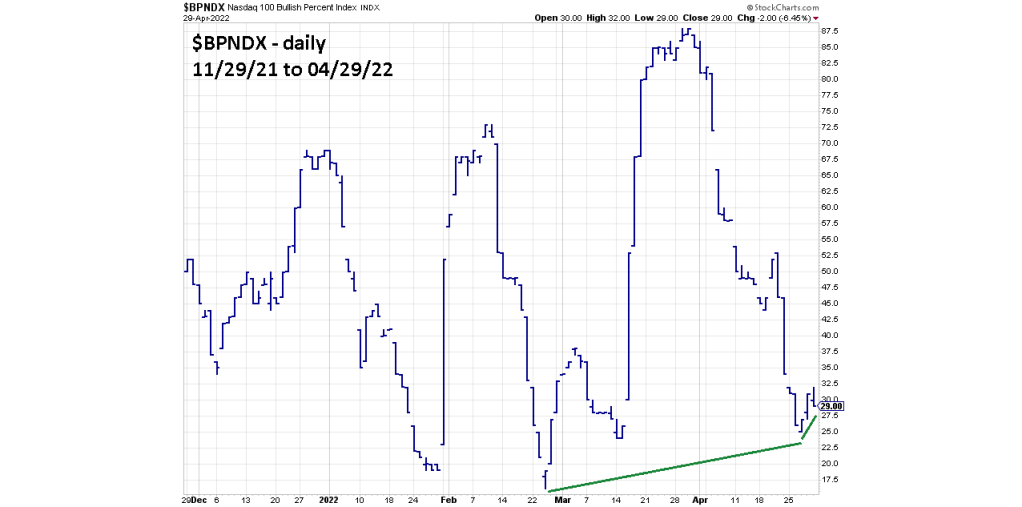
The daily Nasdaq 100 – Bullish Percent Index chart ($BPNDX) shows intermediate and short-term bullish divergences.
The daily SPX – Bullish Percent Index chart ($BPSPX) has a similar message.
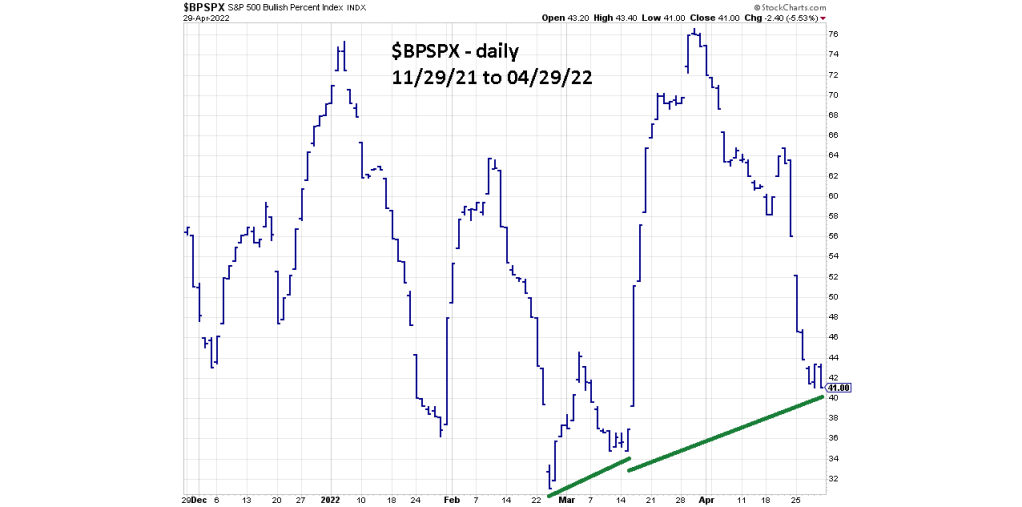
On 04/29/22 $BPSPX went marginally below its 04/27/22 reading . However, there’s a significant double bullish divergence vs. the readings made on 02/24/22 and 03/14/22.
There’s also a powerful signal coming from the Sentiment dimension.
The daily CBOE Options Total Put/Call Ratio Index chart ($CPC) is fascinating.

This chart records the Put/Call ratio at the end of end trading session. High readings mean more Put options are being purchase vs. Call options. This is a contrary indicator – relatively high Put/Call readings signal markets could be at or near a significant bottom.
The $CPC – 04/29/22 reading was the highest since the crash bottom in March of 2020!
Traders panicking while less stocks are making new- 52 – week lows is not what you would expect if a stock market were on the verge of a crash.
Traders entered a 50% long position on SPX non-leveraged related funds at the open of trading 04/29/22. The opening price was 4253.75, stop loss for half of the position was a move below 4188.67. This was a price decrease of 1.5% the loss of half of a 50% position was about four tenths of one percent or .40%. Continue holding long the remaining position.
