The S&P 500 (SPX) rally from 05/02/22 to 05/03/22 looks like a corrective pattern which implies the SPX could go below the 05/02/22 bottom.
The monthly SPX chart courtesy of Trading View illustrates the long- term Elliott wave count.
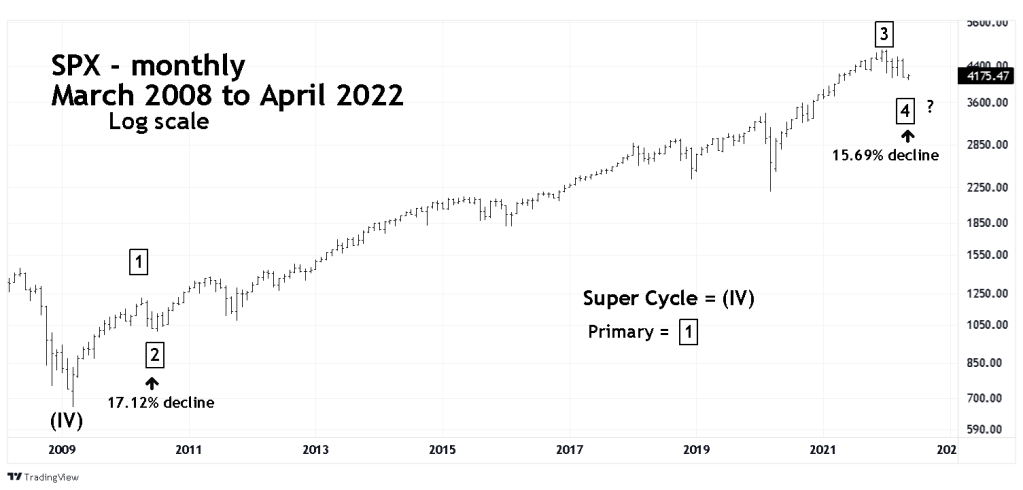
Within Elliott motives waves there’s usually a Fibonacci relationship between waves “two” and “four”. The SPX decline since the 01/04/22 all-time high is close to equal with the Primary wave “2” – boxed. Equality is a common Fibonacci relationship between waves “two” and “four”
The FOMC interest rate announcement will be made on 05/04/22. Traders wait until at least 05/05/22 before entering long positions.
I will have another blog after the end of the SPX 05/04/22 session.
