From 04/21/22 to 04/27/22 the main US stock indices, Dow Jones Industrial Average (DJI), Nasdaq Composite (IXIC), and S&P 500 (SPX) had a powerful and sharp drops. Today 04/28/22 the US Gross domestic product report indicated a 1.4% contraction in the first quarter of 2022. All three main US stock indices rallied strongly on the news. The decline into 04/27/22 and rally on 04/28/22 looks like a case of sell the rumor and buy the fact.
On 04/27/22 only the IXIC made a new 2022 decline low. The SPX and DJI held above their 02/24/22 bottoms.
The daily DJI, IXIC, and SPX charts courtesy of Trading View illustrates the action.

I call what happened on 04/27/22 a “Rule of the majority” signal. This occurs when one of the three main US stock indices does not make a new high/low. The true trend of the market is revealed by the two indices that do not make a new high/low.
This is a broad momentum indicator. The first signal was on 01/05/22 when the DJI was the only one of the three indices to make a new all-time high. The second signal was on 03/14/22 when the IXIC made an unconfirmed new 2022 low.
On 04/27/22 IXIC – daily RSI also had a bullish momentum divergence.
A look at the weakest Index – IXIC internal momentum reveals fascinating clues.
The daily chart of Nasdaq – New – 52 – Week Lows $NALOW courtesy of StockCharts.com illustrates what’s happened during the 2022 IXIC drop.

There’s a triple bullish divergence with less new IXIC lows at the 02/24/22, 03/14/22 , and 04/27/22 IXIC bottoms.
The daily Nasdaq 100 – Bullish Percent Index ($BPNDX) confirms the bullish divergences recorded by the Nasdaq – New – 52 – Week Lows.

Examination of the SPX reveals additional bullish evidence.
The daily SPX chart courtesy of BigCharts .com shows two bullish signals.
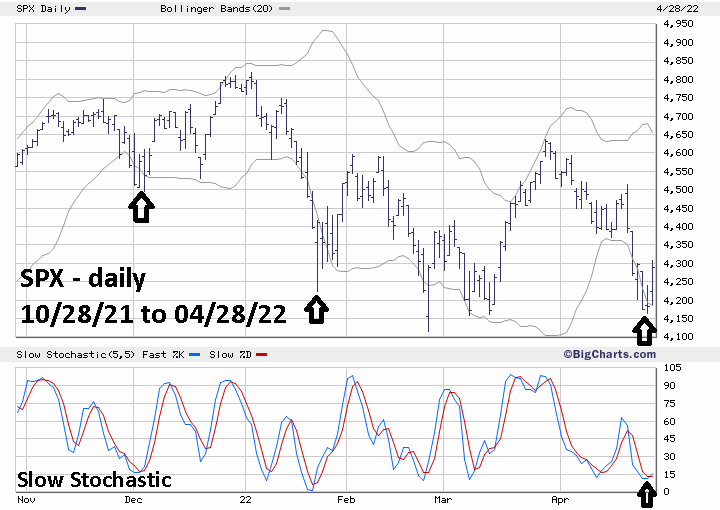
When the SPX has four consecutive days below the lower Bollinger Band and then goes back above the lower band its usually at least a short-term bullish signal. Within the prior six – months there have been two effective signals. Additionally, there was a bullish lines crossover on the daily Slow Stochastic.
The daily VIX chart illustrates two bullish signals.

When the daily VIX high is more than 20% above its 10 – day moving average (MA) it usually signals that the SPX is at or near a bottom. The three prior signals came at short-term SPX bottoms.
Additionally, the maximum VIX reading was on 04/26/22. On 04/27/22 the SPX made a lower bottom, yet VIX decreased. This indicates a lessening of the panic and is a bullish signal for the SPX.
Bullish signals from: Price – Bollinger Bands and Slow Stochastic.
Momentum – RSI, New lows and the Bullish Percent Index.
Sentiment – VIX extreme and divergence.
Time – could be potentially bearish, US stocks are on the cusp of a seasonally bearish period.
The weight of evidence is bullish.
Traders go long 50% non – leveraged SPX related funds at the open of SPX trading on 04/29/22. Use a move below SPX 4188.63 as a stop loss on half of the position. Use a move below 4114.65 as a stop loss for the remaining position.
