The 04/12/22 blog “S&P 500 Decline is Losing Momentum” noted that the S&P 500 (SPX) may have completed an Elliott wave – Double Zigzag correction at the 04/12/22 bottom.
The first 30-minute SPX chart courtesy of Trading View illustrates a completed Double Zigzag at the 04/12/22 bottom.
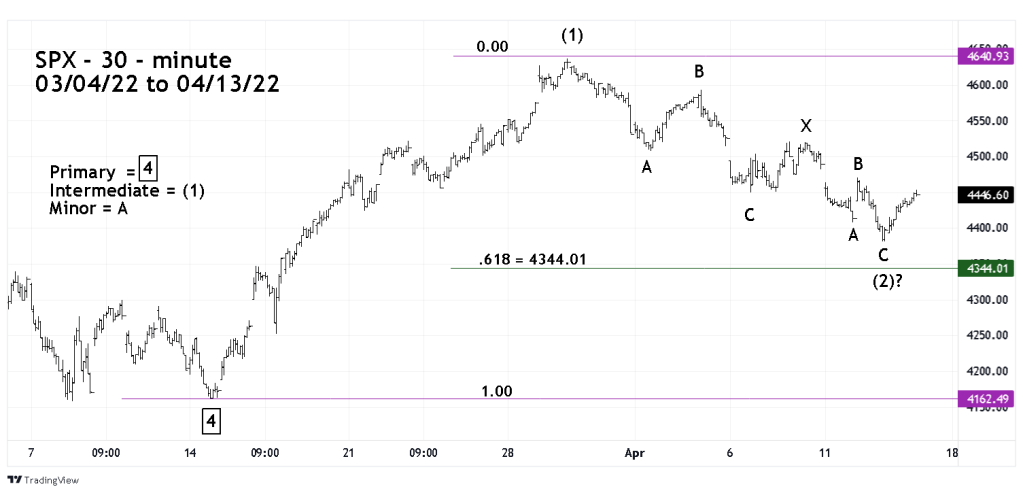
On 04/13/22 the SPX rallied the entire day; this could be the start of Intermediate wave (3) of Primary wave “5” – boxed. However, there’s another interpretation of the 03/29/22 to 04/12/22 decline.
The second 30- minute SPX chart illustrates a wave count with the Double Zigzag still in development.
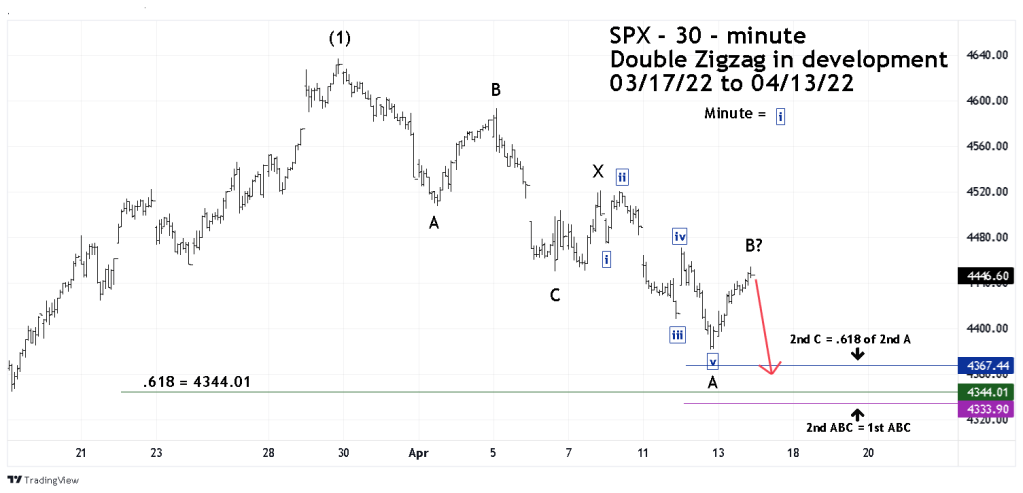
There are two ways to count the middle portion – Minor wave “X” of the Double Zigzag. The presumed Minor wave “X” has two potential peaks, one on 04/07/22 the other is a slightly lower top on 04/08/22. The completed Double Zigzag count uses the lower top as the termination point for Minor wave “X.” However, using the higher top reveals an interesting pattern.
After the 04/07/22 top there’s a complete five – wave impulse pattern that could be Minor wave “A” of a still developing Double Zigzag. This opens the door for some fascinating Fibonacci support points.
The second ABC pattern down from the 04/07/22 Minor wave “X” equals the first ABC pattern at 4333.90 just below the main .618 retracement 4344.01.
If the second Minor wave “C” is .618 of the second Minor wave “A” and subtracted from the presumed second Minor wave “B” at 4453.92 it targets SPX 4367.44 just above the main .618 retracement.
The cluster of three Fibonacci points could be a magnet drawing price to an important support area.
If the SPX declines on 04/14/22 it could be possible to forecast when the drop terminates.
The third 30 – minute SPX chart illustrates a potential time forecast.
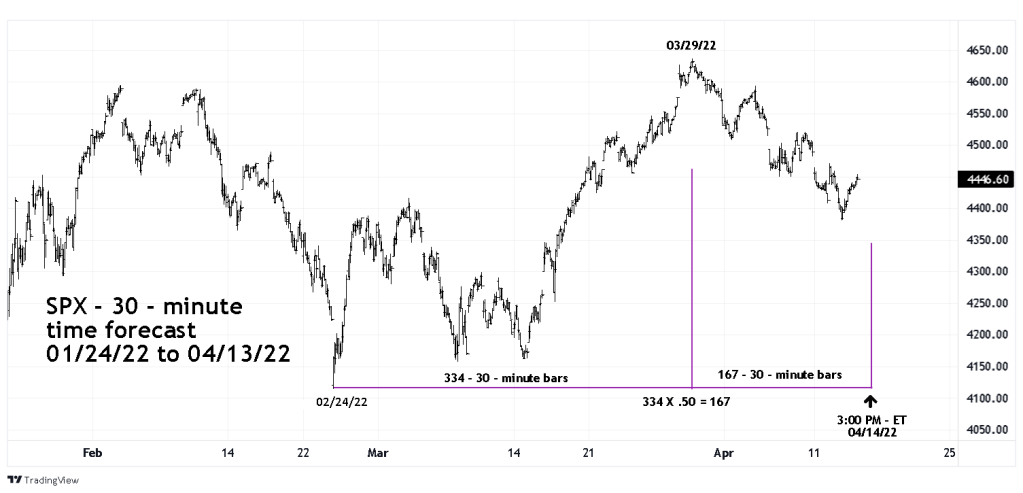
Using the two most significant turn points of the prior two months reveals that the SPX 02/24/22 to 03/29/22 rally lasted 334 – 30 – minute bars multiplied by .50 equals 167 – 30 – minute bars. 167 – bars after the 03/29/22 peak targets a presumed bottom at 12:00 PM – ET on 04/14/22.
The SPX action on 04/14/22 could determine which of the Double Zigzag patterns is correct.
