The 30-minute S&P 500 (SPX) chart courtesy of Trading View illustrates the recent action.
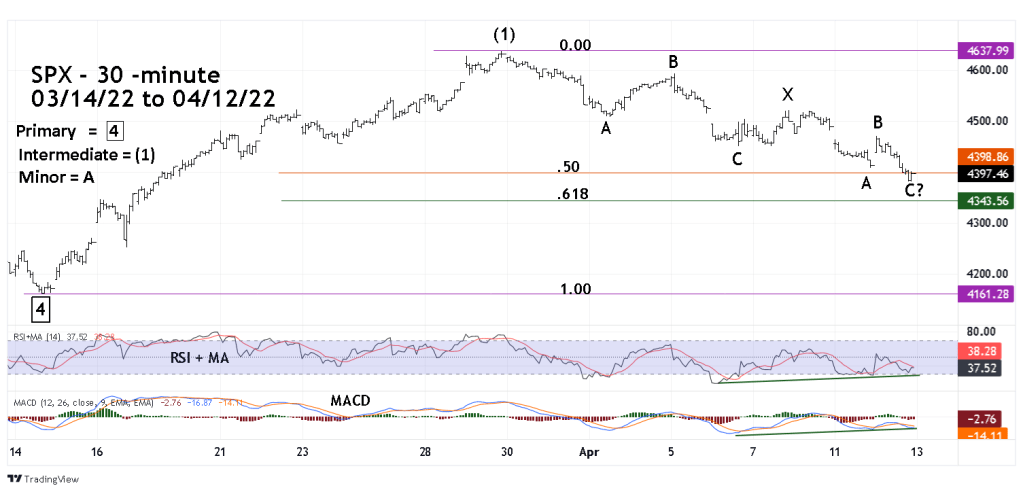
At the 04/12/22 low there were double bullish divergences on the 30- minute MACD and RSI. The overall drop since the 03/29/22 high is choppy and characteristic of Elliott wave – Double Zigzag corrective patterns.
The SPX Bullish Percent Index broke its bullish divergence – noted in the 04/11/22 blog and made a marginal new low. Its possible the SPX completed the Double Zigzag at the 04/12/22 low. If not, the SPX could reach the .618 retracement of 03/14/22 to 03/29/22 rally.
