Recent blogs have noted that the S&P 500 (SPX) decline since the 03/29/22 high could be an Elliott wave – Double Zigzag corrective pattern.
The SPX – 30 – minute chart courtesy of Trading View updates the Elliott wave count.
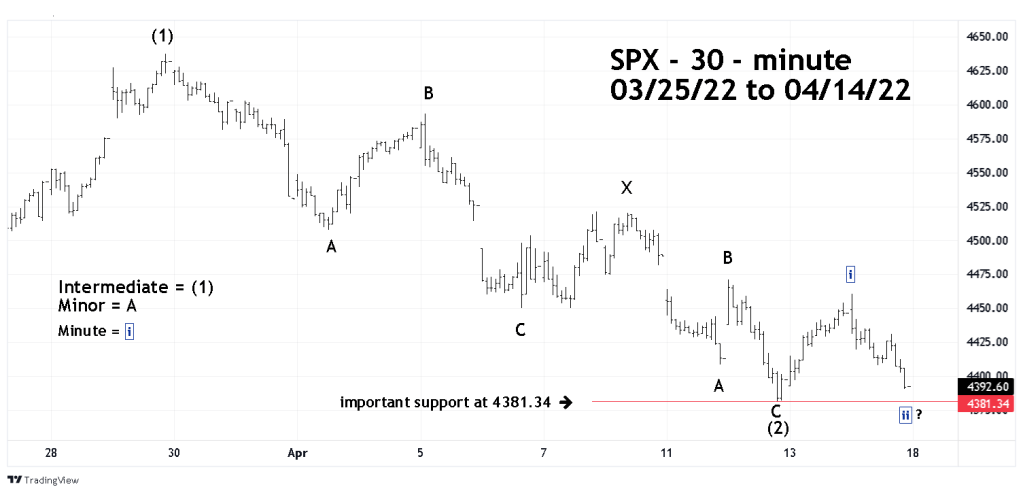
The 04/13/22 blog “Short – Term Bottom Forecast” illustrated two possible SPX Elliott wave counts. One count had the Double Zigzag correction completing at the 04/12/22 bottom. The other had the Double Zigzag completing below the 04/12/22 bottom possibly in the area of SPX 4333 to 4367.
The SPX action on 04/13/22 and 04/14/22 produced clues that the Double Zigzag correction may have completed on 04/12/22.
The SPX – 3 – minute chart zooms in on the very short-term Elliott wave count.
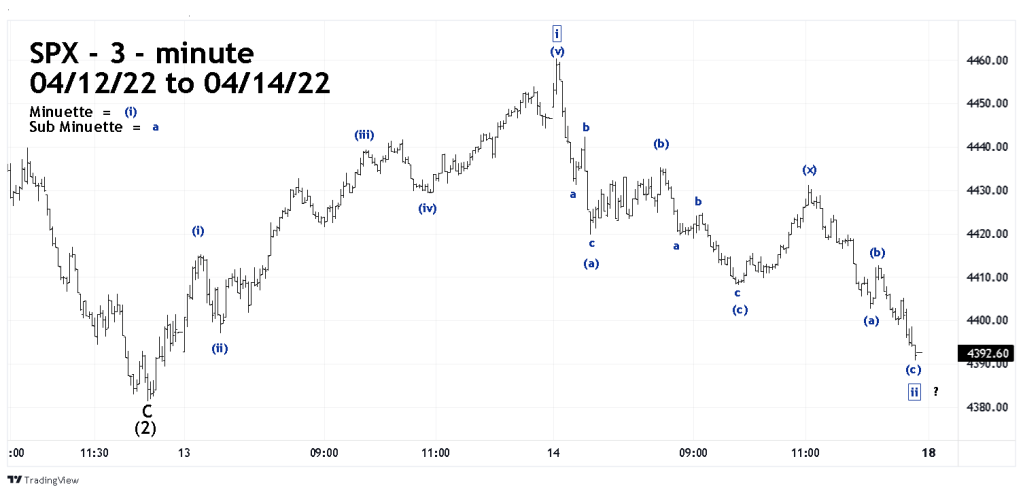
The SPX move up from the 04/12/22 bottom can count as a five – wave Elliott impulse pattern. The decline from the 04/14/22 high appears to be a Double Zigzag. What’s fascinating about this structure are the sub waves of the first Zigzag. Note that the first Minuette waves (a) and (c) themselves subdivide into Zigzags.
Sometimes Elliott wave corrective patterns can have sub waves that are also corrective patterns. The Zigzags within a larger Zigzag provides powerful evidence that the SPX 04/14/22 decline is a correction of the progress up from the 04/12/22 bottom. If so, there’s a high probability that the SPX could go up on 04/18/22.
The Dow Jones Industrial Average (DJI) – 30-minute chart illustrates its intraday Elliott wave count.
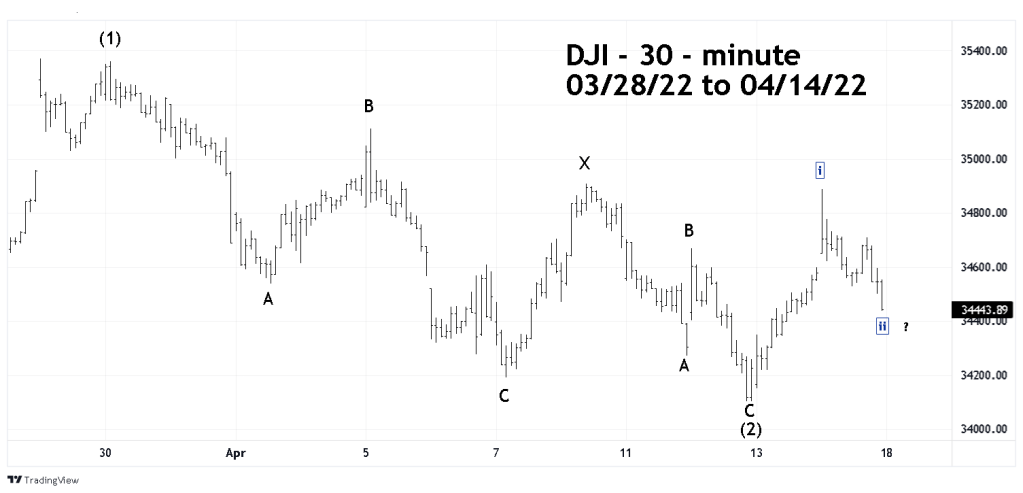
The DJI drop from its late March high also counts as a Double Zigzag. Also note that the DJI late 04/14/22 low is much higher to its 04/12/22 bottom – relative to the SPX 04/12/22 bottom. The DJI bullish strength relative to the SPX is additional evidence that a new bull trend could be beginning.
The next blog will examine other examples of developing bullish momentum.
