On 04/07/22 at mid-day the S&P 500 (SPX) declined to 4450.30 just above the 04/06/22 low at 4450.04.
The SPX – 15-minute chart courtesy of Trading View illustrates the action.
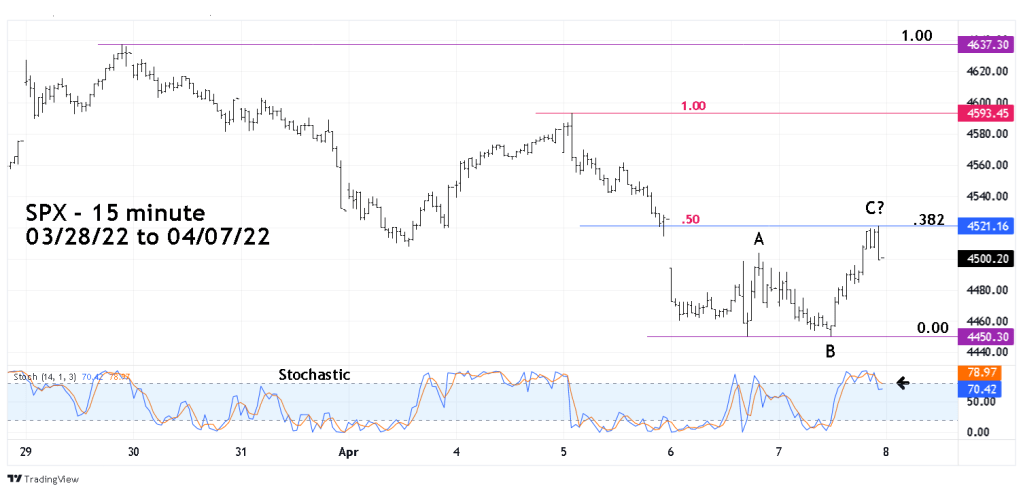
The subsequent rally peaked at 4521.16 almost a bulls eye hit of the Fibonacci .382 retracement of the 03/29/22 to 04/06/22 decline. The exact .382 level is 4521.57.
There’s also a secondary Fibonacci coordinate from the 04/05/22 peak at 4593.45. This coordinate is a .50 retracement of the drop from 04/05/22 to 04/06/22. The exact .50 level is 4521.74.
Late in the trading session there was a small decline. The 15 – minute Stochastic had a bearish lines crossover and is in the upper area of the neutral zone.
At the end of the trading session the NYSE recorded 42% stocks advancing and 54% stocks declining. The advance/decline ratio was bearish for almost the entire trading session. The bearish intraday ratio is not what you would expect on the start of a multi-day rally.
The bearish advance/decline ratio and the potentially bearish Stochastic with the SPX rallying into two Fibonacci resistance points are the ingredients for a new wave down.
If the SPX breaks below the 04/06/22 bottom at 4450.04 it could trigger a drop to the low 4200 area.

I see strong support at 4450. The 4450 line was touched twice this week, and both times there was an immediate reaction.
LikeLike
I agree my next blog will examine that bottom and today’s – 04/08/22 top.
LikeLike