The 04/06/22 blog “Support Reached and Breached” noted that the S&P 500 (SPX) early day bottom at 4460.00 was near two Fibonacci support points at 4463.72 at 4455.63. Later in the trading session this support was broken, and the SPX made a lower bottom at 4450.04.
It appeared that this break could open the door for a decline down to the low 4200 area. However, the next trading day – 04/07/22 the SPX reached 4450.30, almost an exact hit of the prior day bottom. The double bottom has established a new important support level.
The 04/07/22 blog “Rally into Resistance” noted the test of the prior day low and the subsequent rally into two Fibonacci resistance points at 4521.57 and 4521.74. The SPX high on 04/07/22 was 4521.16. The next trading day – 04/08/22 the SPX high was 4520.41 creating a double top.
The SPX -15 – minute chart courtesy of Trading View illustrates the double top and bottom.
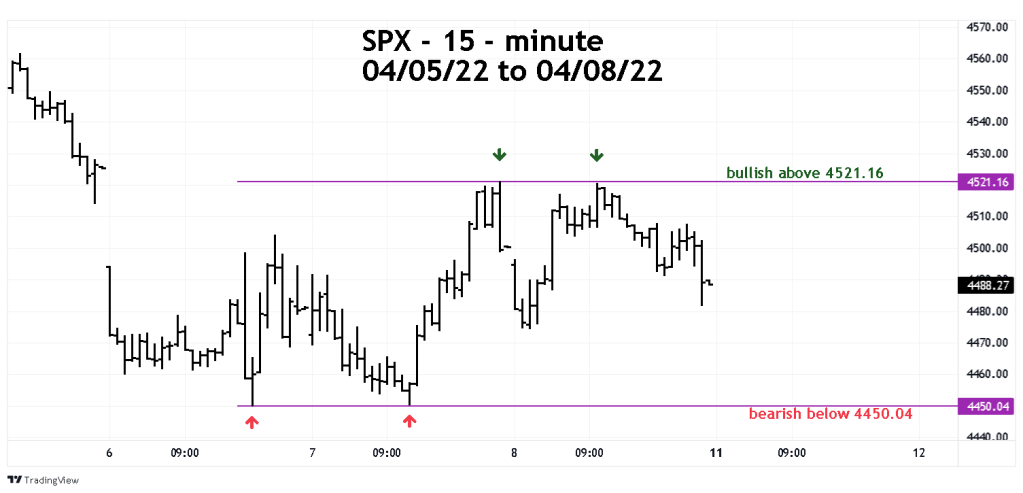
A break above the top could trigger at least a multi-day rally. A break below the bottom could trigger at least a multi-day decline.
Time is running out for stock bulls. Seasonal patterns for US stocks are bullish into late April/May – there are only fourteen trading days remaining in April.
Time is not the only factor stock bulls have to contend with. While the SPX meandered in a three-day trading range, the yield/rates on US government bonds/notes have been rising.
Money gravitates to where its treated best.
Soon, if not already, stock fund managers could be allocating some of their money into short-term US government notes.
The next blog will examine the rise of interest rates and an alternate bearish SPX – Elliott wave count.
