During the first half of the S&P 500 (SPX) 04/06/22 trading session the bottom was 4460.00, only a few points below the .382 retracement of the 03/14/22 to 03/29/22 rally. The exact level is 4463.72. There’s also a secondary Fibonacci coordinate of Minor wave “C” equaling Minor wave “A” at 4455.63.
It looked as if the 4460.00 low could be an important bottom however this bottom couldn’t hold even during the session. Later at 2:00 PM – ET the release of the FOMC minutes triggered a sharp drop to 4450.02.
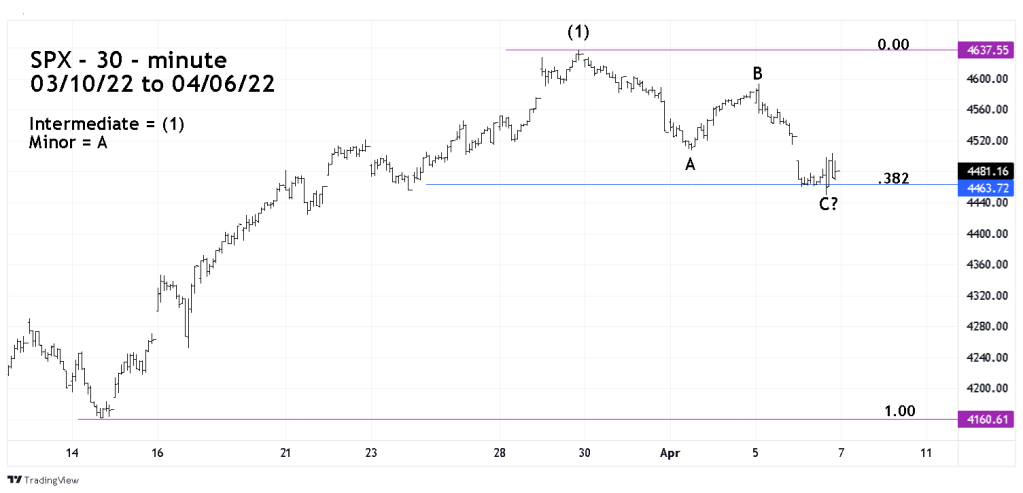
The SPX – 30- minute chart courtesy of Trading View illustrates the action since the 03/14/22 bottom.
The break below two Fibonacci coordinates that were made in the first half of the 04/06/22 sessions casts doubt on the bottom made at 4450.02.
Wait to see what happens on 04/07/22. If the bottom at 4450.02 is broken it could open the door for an SPX move to the low 4200 area,

Thanks for sharing this vital information, Mark!
> WordPress.com
LikeLike
Glad I can help.
LikeLike