The 11/30/21 blog “Bearish November Omen” noted that the intraday decline of the S&P 500 (SPX) since the 11/22/21 top looked corrective. Subsequently the SPX decline continued to look corrective.
The SPX – 15- minute chart courtesy of BigCharts.com illustrates the intraday action since the 11/22/21 all-time high.
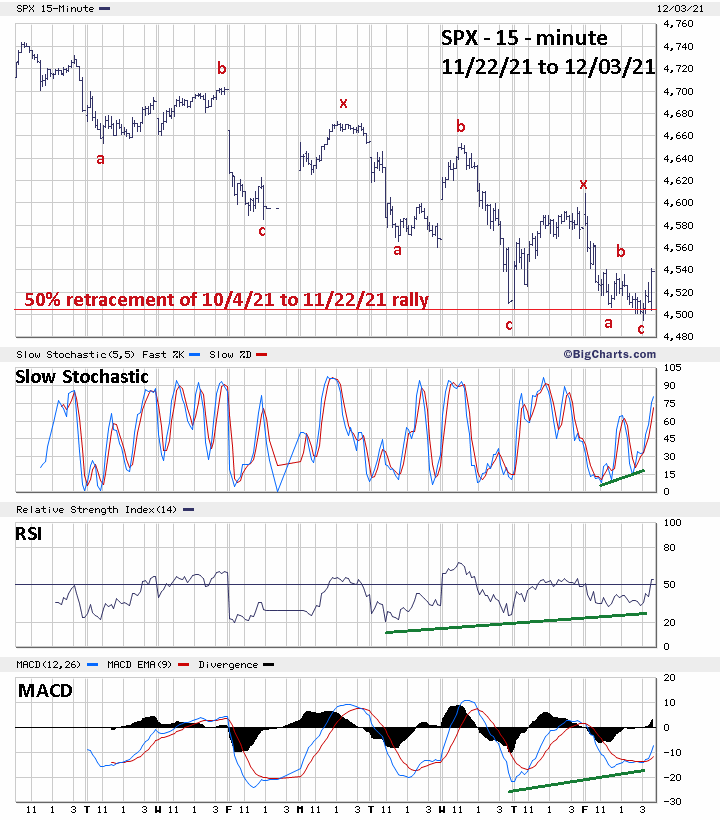
The easiest way to explain Elliott wave theory is straight lines followed by crooked lines. The straight lines are the primary trend. The crooked or choppy lines are the corrections of the primary trend. Choppiness is the signature of corrections in any market. Note the four deep retracements , labeled “b” and “x” of the decline since 11/22/21.
If the there’s a change of the primary trend from up to down the most likely scenario would have a decline then a deep retracement of that drop. In the illustrated SPX chart this is the first wave “a” down followed by the first “b” up.
If the primary trend were down, most likely after first retracement there would be another decline – very deep, with a subsequent rally that’s shallow and far away from the price area of the first decline. This is not what has happened since the 11/22/21 peak.
Note on the chart the rally labeled “x” retraces into the price area of the first wave “a” down. The subsequent second “b” rally retraced into the area of the first wave “c” decline. The second “x” rally retraces into the price area of the second wave “a” down.
The SPX decline from 11/22/21 to 12/03/21 appears to be a Triple Zigzag. Within the Zigzag family of corrections there are Single, Double, and Triple Zigzags.
When you see choppy action with overlaps of prior bottoms/tops it’s most likely a correction of the primary trend. In this case it implies the SPX could rally back at least to the area of the all-time high made on 11/22/21.
Supporting evidence that the SPX decline from the 11/22/21 high is likely a correction comes from the momentum dimension.
Note the significant bullish divergences from the 15 – minute Slow Stochastic, RSI and MACD.
Additional evidence of a near term bottom is illustrated in the daily SPX chart courtesy of Trading View.
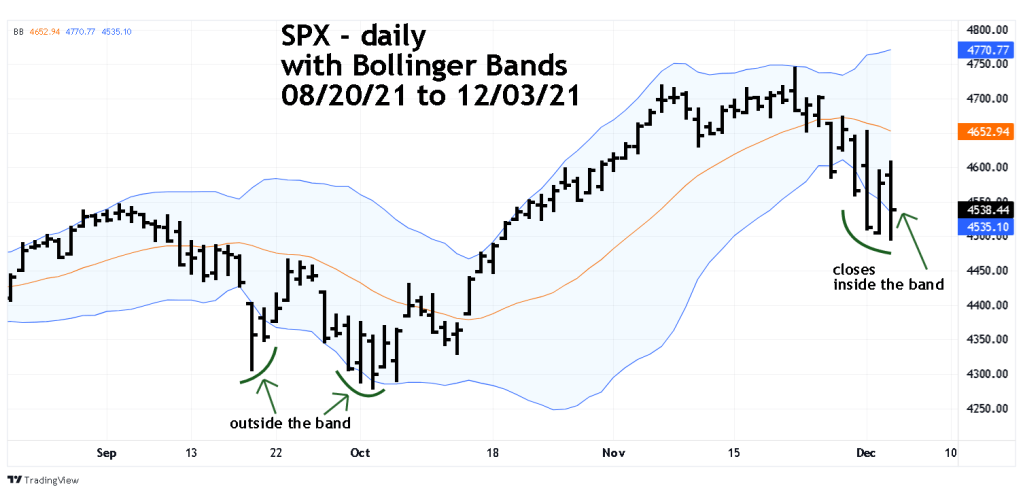
In mid – September the decline culminated with two trading day breaks below the lower Bollinger Band. In late September to early October there was a three-trading day breaks below the lower band. Now since late November there have been four consecutive days of moves below the lower band – rare and implies selling exhaustion.
Also note that moves back above the lower band signals at least a short-term uptrend. The SPX closed the 12/03/21 session above the lower Bollinger band.
The SPX appears to be poised for a rally into December. Prior blogs have noted a Fibonacci time cycle pointing to December 2021 as a time when a major US stock market peak could occur. If the SPX can make a new all-time high in December 2021 it could mark the termination point of the bull move that began in March 2020.

Mark, thanks for the very interesting article.
I am curious about the comments regarding the nature of the downward waves when a bear market trend has begun (first wave followed by retracement followed by a sharp decline for which the retracement does not approach the area of the first decline). Where does this information come from?
I back tested this against the start of the 2000 bear market using SPX and the back test results don’t agree very closely with the described nature of the downward waves. SPX formed a double top in 2000, and the declines for each top do not agree very well with the pattern you described for a change in the primary trend
In March of 2000, there were shallow declines followed by a sharp decline in mid-April. But there was a very powerful retracement wave that followed the sharp decline that ended on 4/25/2000 which represented a 72% retracement of the total drop. The retracement did not quite reach the first low, but it came fairly close.
The slide from the second top that began in Sept of 2000 does not match the described nature of the downward waves at all. It is not easy to identify a first down wave. Instead, a steady one month slide was observed, followed by a similar slide that lasted two months, followed by a third slide that lasted three months. Each slide was similar in magnitude, and in each case, large retracements took place.
Why doesn’t the SPX price action in 2000 follow the described pattern for a change in the primary trend as described in your blog?
LikeLike
Hi David
Great question and great observation of the price action in 2000. The information about not approching the area of the first decline is a main part of Elliott wave theory and is explained in the Frost and Prechter book “Elliott Wave Principle”.
What happened at the major top made in 2000 was usual. There was several months of chop and the big decline did not come until 2001. The entire bear move from 2000 until 2002 was in Elliott wave terms a corective pattern, impllying that in a few years the top made in 2000 could be exceeded – which did happen.
The same phenomenon could be repeating itself again with with the SPX decline 11/22/21 to 12/03/21. The current momentum evidence implies a high probability of an SPX rally for at least a few days. I suspect the SPX could make a new all-time high however there are two other alternate wave counts in which the SPX could retrace about 85 to 90% of the recent drop and then have a sharp decline.
When analyzing any market we are dealing with probabilities not certainty. We need to be prepared for any contingency.
The SPX pattern from 11/22/21 to 12/03/21 has a high probability of being a correction of the primary trend – it is not a certainty.
Remember the overall evidence from the US stock market. Especially the recent bearish November. As I wrote in the 11/30/21 blog this is a severly wounded bull market.
Thanks again for this great question and observation.
Mark
LikeLike