The prior blog “Important Support Levels Broken – 11/19/26 noted that a break below the S&P 500 (SPX) 06/09/26 bottom at 7,237.85 could be a panic point. Subsequently SPX fell 3.6 percent, its seventh consecutive decline and longest losing streak since February 2020. U.S stocks could be in a mini crash. Comparison with the most recent SPX bear phases could give us parameters for a mini crash bottom.
The daily SPX chart courtesy of Trading View examines what happened during the bear phases of 2025 and early 2026.
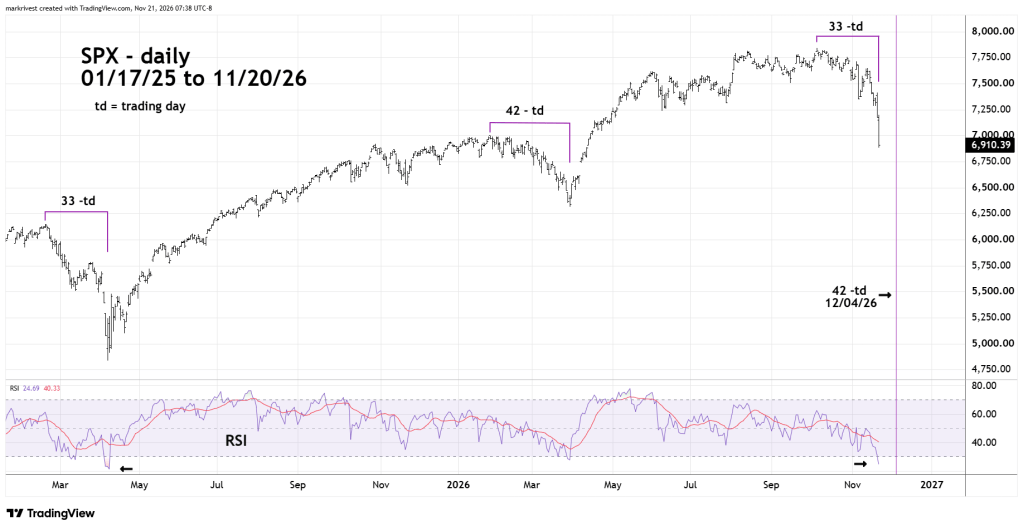
The February to April 2025 decline lasted 33 – trading days.
The January to March 2026 decline lasted 42 – trading days.
The current decline since October 2026 has lasted 33 – trading days.
It’s possible a mini crash bottom is in place as of 11/20/26. However, there are two other dates for a potential bottom. If the post October 2026 decline matches the 2025 bear phase, then 42 – trading days after the October 2026 peak targets 12/04/26.
There’s another date that could be a bottom.
Markets can sometime have turns on Full/New Moons plus or minus two trading days. There’s a Full Moon on 11/24/26.
Daily RSI on 11/20/26 was 24.69. The daily RSI low in April 2025 was 21.36; there’s room for more downside action.
We could be in a situation like October 1987. On Friday 10/16/87 U.S. stocks were already in a very steep decline. Over the weekend fear increased. Monday 10/19/87 was the strongest down day of the October 1987 decline. The bottom was made on Tuesday 10/20/87.
On 11/23/26 it’s possible SPX could decline about 9% and reach area of the 03/30/26 bottom at 6,316.91.

