The 11/09/26 blog “Comparison of the 1987 and 2020 Crashes” noted that the S&P 500 (SPX) 06/09/26 bottom at 7,237.85 could be a panic point. On 11/19/26 SPX broke below that bottom and two other support levels.
The daily SPX chart courtesy of Trading View shows what happened.
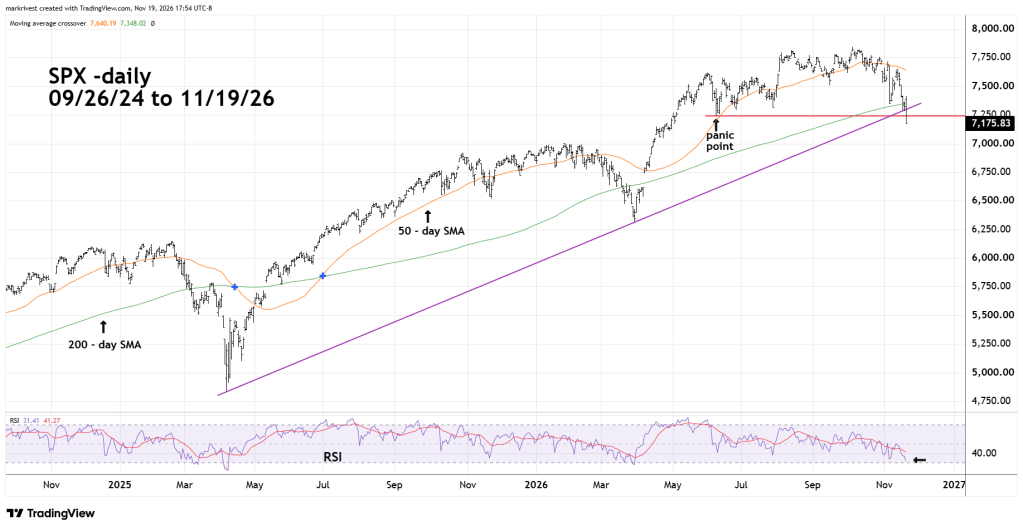
Please note that below 7,237 there’s no significant chart support until the late March 2026 bottom. Its possible SPX could reach the 6,300 area in the first week of December 2026.
SPX also broke the rising trendline connecting the April 2025 and March 2026 bottoms. Many stock fund managers make buy/sell decisions based on the SPX – 200 – day Simple Moving Average (SMA). On 11/19/26 – SPX ended the session decisively below its 200 – day SMA.
Daily SPX – RSI is at 31.41 the oversold zone begins at 30.00. Even if RSI reaches the oversold zone, bullish RSI divergence could develop within the oversold zone.
The daily Russell 2000 (RUT) chart updates its action.
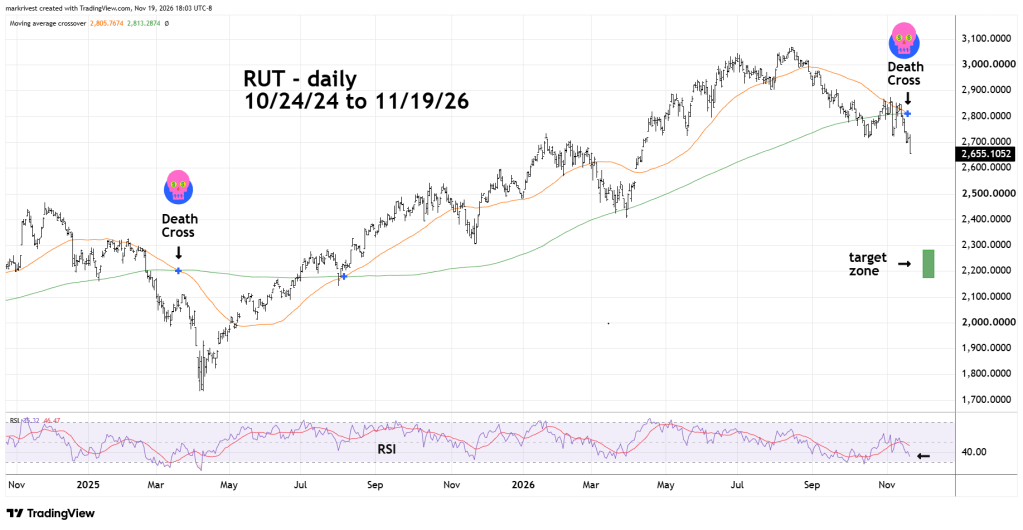
When the 50 – day SMA crosses below the 200 – day SMA it’s called a Death Cross. On 11/18/26 – RUT had a Death Cross. Note that the prior Death Cross signaled an 18% decline that lasted about two – weeks. If the current signal is similar, RUT could reach the 2,300 area sometime in the first week of December 2026.

