The 10/29/26 blog “Elliott Wave Examination of Two U.S. Stock indices” illustrated that the S&P 500 (SPX) could be forming an Elliott wave – Horizontal Triangle. That pattern could still be forming. However, the SPX gap down on 10/30/26 has changed the configuration.
The daily SPX chart courtesy of Trading View updates the Elliott wave count.
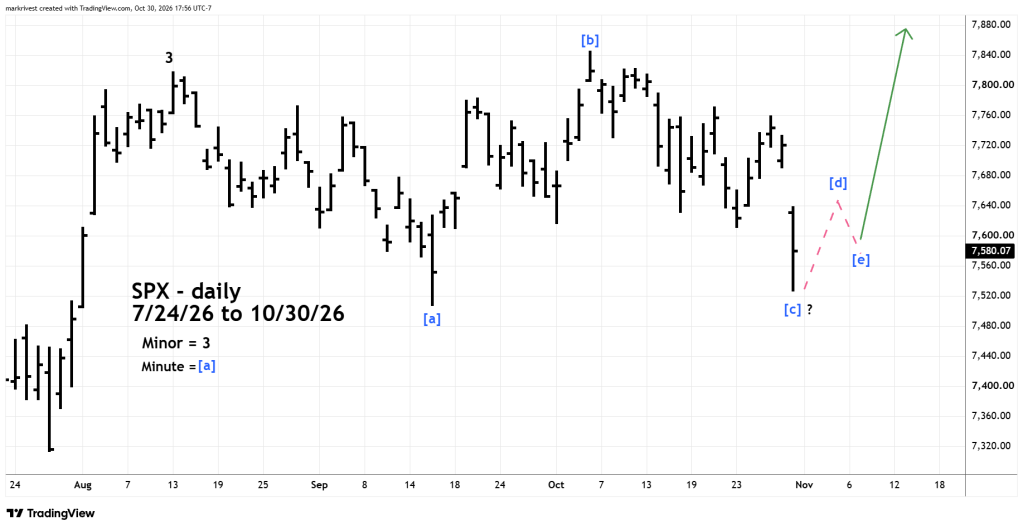
The SPX bottom made on 10/30/26 could be Minute wave [ c ] of a developing Horizontal Triangle. If so, Minute waves [ d ] and [ e ] need to form before a thrust to a new all-time high.
A move below the presumed Minute wave [ a ] low made on 9/16/26 at 7,507.77 will invalidate this wave count.

