Within a few trading days a small number of U.S. stocks could make new all-time highs. Most stocks may rally into secondary peaks. A look at the S&P 500 (SPX) and Russell 2000 (RUT) Elliott wave counts reveal what may happen.
The daily SPX chart courtesy of Trading View updates its action.
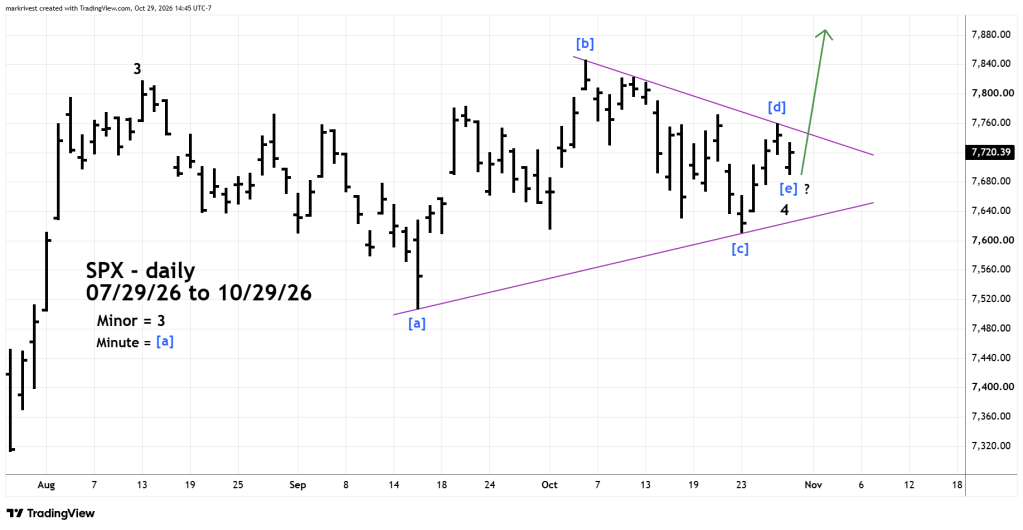
The daily SPX chart courtesy of Trading View updates its action.
The 10/22/26 blog “The Three – Day Rally” illustrated that the SPX could be forming an Elliott wave – Ending Diagonal Triangle from the 08/13/26 peak. This is still a valid wave count, but it could also be an Elliott wave – Horizontal Triangle. Both have the same message – a final multi-day thrust up. However, the Horizonal Triangle count allows for greater upside potential. As of 10/29/26 it’s possible the presumed Minute wave [ e ] of Minor wave “4” could still be forming. An upside project cannot be made until the Minor wave “4 “bottom is in place.
The daily RUT chart illustrates the movement from its peak 08/14/26.
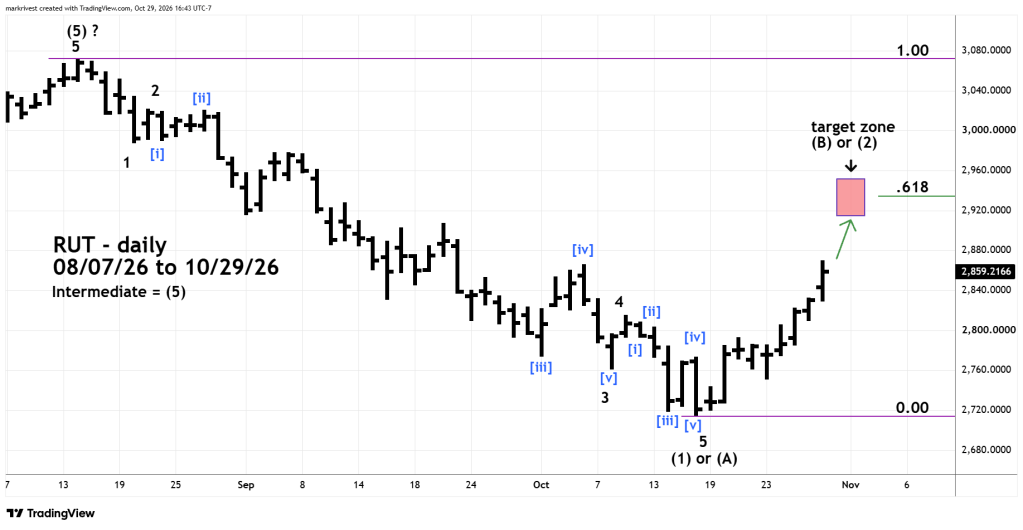
The move down has an Impulsive Elliott wave look and sub divides into five waves. If this wave count is correct, it could be the first move down of a larger developing bear move.
Typically, there’s about a two – thirds retracement of a wave “1” or “A”. The Fibonacci .618 retrace of the August to October decline could be the bullseye level for a peak.
Sometimes the turn of a new month can trigger a trend change. November 2, 2026, is the first trading day of the month. The U.S. mid-term elections are on November 3, 2026.

